

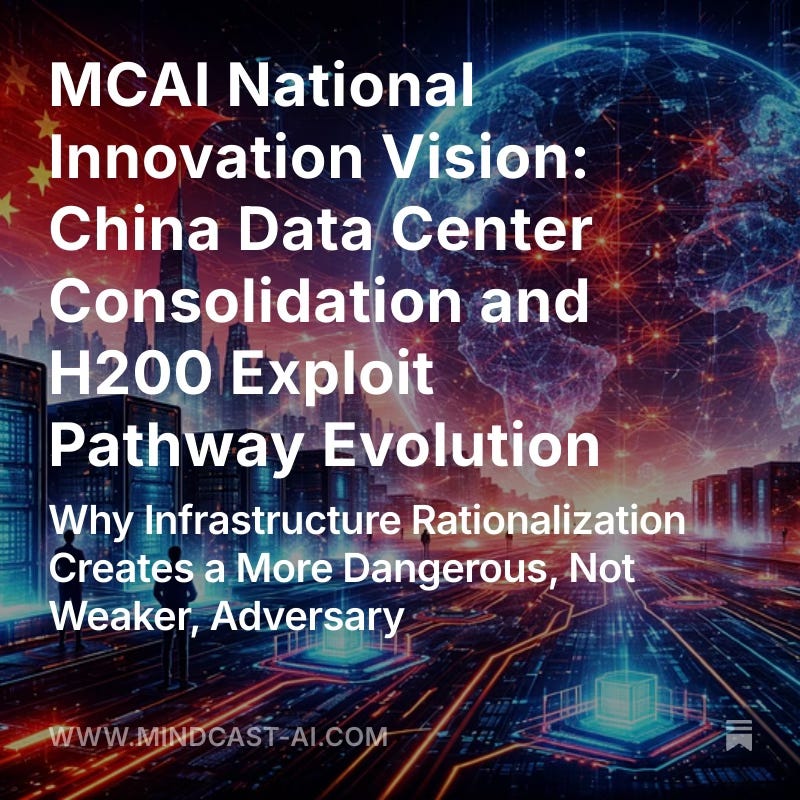
MCAI National Innovation Vision: China Data Center Consolidation and H200 Exploit Pathway Evolution
Why Infrastructure Rationalization Creates a More Dangerous, Not Weaker, Adversary

Executive Summary
Methodological note: All probability ranges below are scenario estimates, not empirical frequencies. The strategic claim depends on their relative ordering (exploit ≫ detection), not point precision. Conclusions are conditional on consolidation reaching ≥40% of approved entities by Q2 2027.
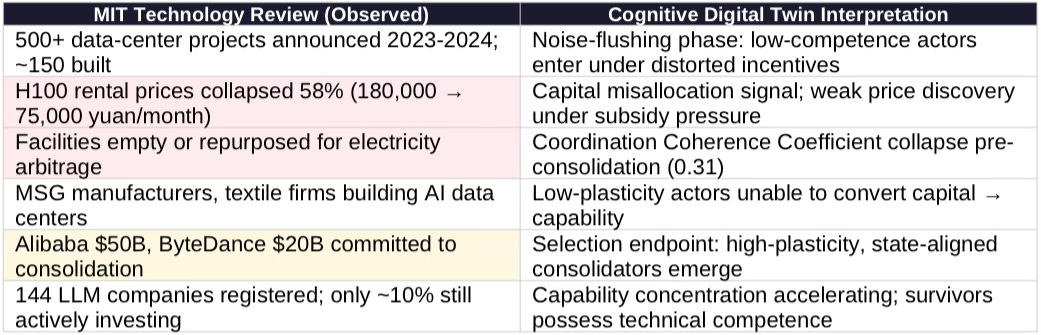
In March 2025, MIT Technology Review documented the collapse of China’s AI data center boom: 500+ projects announced, ~150 built, GPU rental prices down 58%, facilities repurposed for electricity arbitrage. China built hundreds of AI data centers to catch the AI boom. Now many stand unused (Mar 2025). The conventional interpretation frames this as Chinese strategic failure. That interpretation is wrong.
MIT documented the transition phase. Cognitive Digital Twin analysis models the endpoint: forced rationalization that concentrates infrastructure under state-coordinated, technically competent operators (Alibaba $50B, ByteDance $20B committed) inheriting distressed assets at 20-40 cents on the dollar. The core finding: consolidation increases exploit probability (+11-16%) while decreasing detection probability (-4-8%). The policy gap between approval and monitoring now operates where approved customers possess greater sophistication, state backing, and resources for compliance theater.
Key Findings
Exploit probability rises: Drift 62%→78%; PE/State 74%→85%; JV 71%→82%; Arbitrage 68%→79%
Detection probability falls: Drift 21%→14%; PE 14%→8%; JV 9%→5%; Arbitrage 26%→18%
Strategic gap widens: 36-65 points → 60-80 points (even with ±10-15pp error, ordering holds)
Timeline: Q2 2027 lock-in point; controls after this face self-sustaining exploit ecosystem
Pathway convergence: Four exploit mechanisms now reinforce each other through consolidated infrastructure
The gate without the fence is now guarded by professionals. Access-layer controls must be implemented before H200 approval takes effect, or capability transfer is essentially certain.
I. Empirical Foundation: The MIT Case
MIT Technology Review reporting (Chen, March 2025) documents coordination failure dynamics that Cognitive Digital Twin analysis extends to model consolidation endpoints. The table below maps each observed phenomenon to its strategic projection, making visible the boundary between journalism and model application.
Reframing the Dominant Interpretation
Much secondary commentary reads the MIT findings as evidence of Chinese weakness or strategic overreach. The weakness interpretation is comforting—but incorrect. The observed bust reflects pre-consolidation selection, not terminal failure. Capital destruction preceded capability formation; consolidation reverses the ratio.
The correct frame:
Bust ≠ weakness. The bust eliminates actors who could not convert capital to capability.
Bust = filtering mechanism. Market failure is the selection pressure that produces competent survivors.
Strength emerges after the bust, not before. Post-consolidation entities inherit infrastructure without inheriting incompetence.
Analytical Extension: From MIT Observation to Strategic Projection
MIT’s March 2025 reporting provides the empirical foundation. The MindCast AI National Innovation Vision series (November-December 2025) extends that foundation to model consolidation endpoints that MIT did not project. The analytical contribution lies in identifying what the bust portends—not weakness, but selection pressure that produces dangerous coherence.
Core analytical frame: MIT observed coordination failure; CDT projects that coordination failure precedes consolidation, and consolidation amplifies exploit capacity while reducing detectability.
1. H200 Exploit Pathways — Extended from MIT Data
MIT Observation: 500+ projects announced, only ~150 built. GPU prices collapsed 58%. Facilities repurposed for electricity arbitrage and subsidy capture. Technically incompetent operators exited.
CDT Extension: Chaotic overbuilding constitutes a noise-flushing phase that removes low-capability actors. Consolidation leaves precisely the concentrated, technically competent entities that exploit pathways require.
Publication: Foresight Simulation of NVIDIA H200 China Policy Exploit Vectors, December 2025
Strategic Implication: Exploit probability rises, not falls. Detection probability drops.
2. The Global Innovation Trap — Extended from MIT Data
MIT Observation: Local officials optimized for visible infrastructure, not demand. Middlemen exaggerated AI demand. Capital destroyed without capability formation.
CDT Extension: Capital ≠ capability. Misallocated capital accelerates the shift from advantage to liability. Once consolidation begins, capital finally converts to capability—but under state-coordinated control.
Publication: The Global Innovation Trap, November 2025
Strategic Implication: Innovation advantage window compresses further as consolidation enables efficient capital-to-capability conversion.
3. Aerospace’s Warning to AI — Extended from MIT Data
MIT Observation: Facilities optimized for pretraining stranded. Surviving infrastructure repositioned for inference and arbitrage. Compute access decoupled from physical location.
CDT Extension: Access-layer control becomes decisive as hardware ownership changes but compute routing becomes fluid. The real export boundary is the access layer, not physical hardware.
Publication: Aerospace’s Warning to AI, November 2025
Strategic Implication: Export control anchored to hardware custody is obsolete.
4. Illegal GPU Export Pathways — Extended from MIT Data
MIT Observation: Incompetent actors exited. State-backed firms expected to absorb distressed assets. Consolidation under Alibaba, ByteDance, SOEs.
CDT Extension: Consolidation creates actors capable of sustaining sophisticated compliance architectures. Opacity emerges not from smuggling alone, but from engineered compliance once competent actors dominate.
Publication: Foresight Analysis in Illegal GPU Export Pathways, November 2025
Strategic Implication: Designed opacity, not accidental leakage.
Bottom Line: Chaos was never the threat. Coherence is. MIT documented the chaos; CDT models the coherence that follows.
With empirical confirmation established, the analysis now quantifies how consolidation shifts exploit and detection probabilities across five diagnostic dimensions.
Contact mcai@mindcast-ai.com to partner with us on National Innovation foresight simulations.
II. Cognitive Digital Twin Vision Function Execution
Each Vision Function below models a distinct failure mode in export control architecture. Together, they explain why consolidation degrades the ‘approved customer’ framework from inadequate to actively counterproductive.
A. National Innovation Behavioral Economics Vision
Function: Models how national-level incentive structures propagate through institutional actors to produce aggregate innovation outcomes. Key metric—Coordination Coherence Coefficient (CCC): the share of policy intent that actually converts to deployed capability (0 = total misalignment, 1 = perfect execution).
Pre-consolidation: Principal-agent misalignment severe (>70% divergence). Local officials optimized for visible projects, not capability. Middlemen extracted 15-25% through subsidy capture. CCC collapsed to 0.31. Capital Efficiency Ratio: 0.22—for every yuan invested, only ¥0.22 converted to deployable AI capability.
Post-consolidation: State-backed entities directly accountable to central policy. Divergence projected <25%. CCC rises to 0.58-0.67 (0.55-0.70 range; medium confidence). Capital Efficiency Ratio: 0.61 (0.55-0.68 range)—2.8x improvement. Net effect: China transforms from inefficient capital allocator to efficient capability converter.
B. Causal Signal Integrity Vision
Function: Measures traceability of action chains from policy intent through execution. Intuitive gloss: Causal Signal Integrity answers “can an outside observer trace what an actor says to what they do?” Scores below 0.10 indicate chains engineered for opacity.
Causal Signal Integrity Paradox: Internal coherence rises dramatically (0.19→0.58) as consolidated operators align objectives. But external-facing traceability falls (toward U.S. regulators) to 0.08-0.12 as sophisticated actors construct deliberate opacity layers. The chaotic buildout was transparent in its dysfunction; consolidated operators will be opaque by design.

Causal Signal Integrity Assessment: Pre-consolidation ecosystem proved detectable because incoherence made violations visible. Post-consolidation entities operate with high internal coherence and deliberate external opacity—the worst combination for enforcement.
C. Institutional Cognitive Plasticity Vision
Function: Measures how quickly institutions adapt behavior when exposed to new constraints. Intuitive gloss: Institutional Cognitive Plasticity answers “how fast can this actor change its playbook?” High plasticity = rapid pivots; low Legacy Inertia = weak constraint from prior commitments.
Adaptation Asymmetry: Pre-consolidation operators (plasticity 0.31) adapted slowly—local governments locked into real estate patterns, textile firms lacked AI infrastructure cognition. Post-consolidation entities (plasticity 0.82) are technology companies optimized for rapid strategic pivots. Bureau of Industry and Security rulemaking (plasticity 0.23) runs 18-36 months; consolidated operators restructure compliance in 3-6 months.
Historical anchors: October 2022 semiconductor controls took 14 months from ANPRM to final rule; the January 2025 AI diffusion framework took 18+ months. Meanwhile, Chinese cloud providers restructured Singapore/Malaysia routing within 4-6 months of each restriction round.
Institutional Plasticity Assessment: Consolidated operators will always be one adaptation cycle ahead of U.S. regulatory response. Controls designed against current behavior will face evolved behavior by implementation date.
D. Chicago School Law and Behavioral Economics Vision
Function: Applies Coase, Becker, and Posner tests to evaluate whether regulatory frameworks produce intended behavioral responses or create arbitrage opportunities.
Coase Test (Transaction Costs): Policy assumes laundering costs exceed benefits. Reality: consolidated entities amortize compliance architecture across massive portfolios, reducing per-transaction cost to near-zero. FAILED.
Becker Test (Incentive Alignment): Policy assumes customer incentives align with compliance. Reality: state-backed entities optimize for national capability development. Expected penalty (low detection × uncertain sanctions) < expected benefit (capability value). FAILED.
Posner Test (Efficient Breach): Breach cost (detection probability × sanction) << capability acquisition value. Rational actors breach. Efficient breach conditions present.
Chicago School Assessment: All three tests fail. The policy produces the form of control without the substance.
E. Disclosure Behavior Vision
Function: Tracks how actors selectively reveal or conceal information based on strategic objectives.
Pre-consolidation: Incoherent disclosure. Fragmented operators lacked sophisticated disclosure management. Violations detectable because actors couldn’t coordinate concealment. Counterparties (textile firms, subsidy-seekers) were low-value, low-risk—they lacked capability to exploit access.
Post-consolidation: Engineered disclosure. Consolidated entities possess resources for professional compliance theater—legal teams, audit preparation, documentation designed to satisfy requirements while enabling divergence. Counterparties (Alibaba, ByteDance, SOEs) are high-value, high-risk—technically sophisticated with strategic mandates.
Disclosure Assessment: Enforcement designed for unsophisticated actors will fail against professional compliance architectures.
All five Vision Functions point in the same direction: consolidation improves Chinese operational coherence while degrading U.S. detection capability. The next section models how the four exploit pathways—previously independent—now reinforce each other through shared infrastructure.
III. Exploit Pathway Convergence Model
Prior analysis modeled four exploit pathways operating independently. Consolidation creates pathway convergence—each mechanism now reinforces the others through shared infrastructure, transforming isolated vulnerabilities into systemic failure.
Stage 1: Consolidation Phase (2025-2026)
State-backed entities acquire distressed data centers at 20-40 cents on the dollar
Facilities with existing GPU installations transfer without new export review
•Approved customer’ credentials attach to corporate entities, not physical infrastructure—consolidators inherit access rights
Rural/western facilities repositioned as pretraining nodes; urban facilities optimized for inference
Stage 2: Infrastructure Integration (2026-2027)
Consolidated compute mesh operates across dozens of facilities with unified orchestration layer
Workload routing obscures which facility processes which job—defeating per-facility monitoring
Training runs fragmented across multiple sites with results aggregated centrally
JV structures emerge connecting approved facilities to ‘research partnerships’ with non-approved entities
Stage 3: Capability Extraction at Scale (2027-2028)
H200s flow to consolidated entities through ‘approved customer’ channel
Compute arbitrage operates professionally: authenticated access from compliant nodes, computation distributed across mesh
Knowledge transfer accelerates as consolidated facilities achieve genuine technical competence
Domestic GPU programs (Huawei Ascend) benefit from architectural insights extracted through legitimate access
Pathway Reinforcement Dynamics
After consolidation, the four pathways cease operating independently:
Approved Customer Drift enables JV Intermediation: drifted customers become JV formation vehicles
State Ownership accelerates Compute Arbitrage: state coordination enables professional-grade arbitrage operations
JV structures legitimize Drift: ‘research partnerships’ provide cover for access-sharing
Arbitrage infrastructure enables JV access: compute-as-a-service offerings flow through JV channels
Pathway convergence means exploit probabilities compound rather than remain independent. The quantification below revises the original H200 probability estimates to account for consolidated infrastructure.
IV. Quantified Probability Revision
Methodological note: Ranges below are scenario-weighted estimates, not empirical sampling distributions. Confidence descriptors refer to directional certainty; magnitude estimates carry wider bands. The strategic conclusion depends on directional asymmetry (exploit rising, detection falling), not point precision.
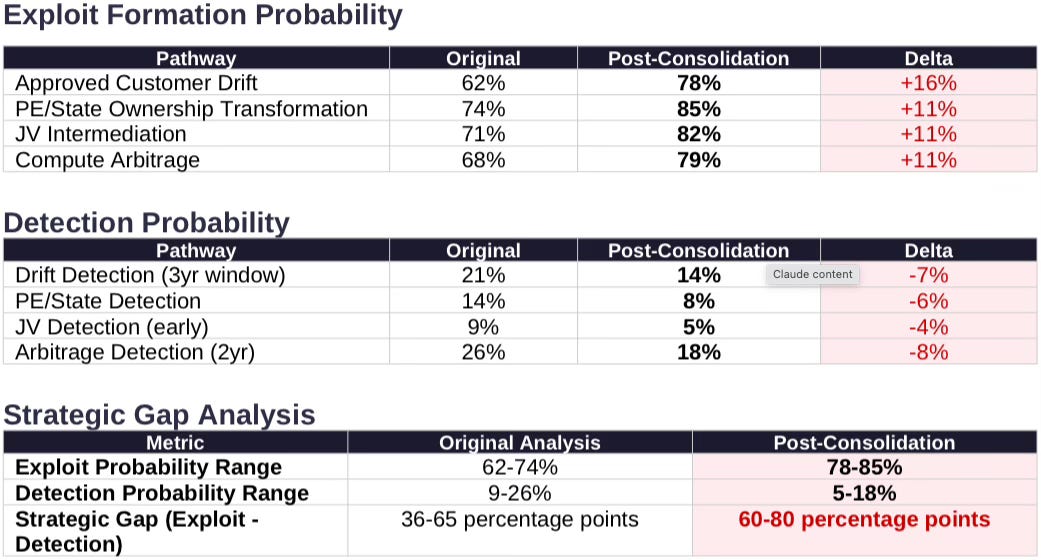
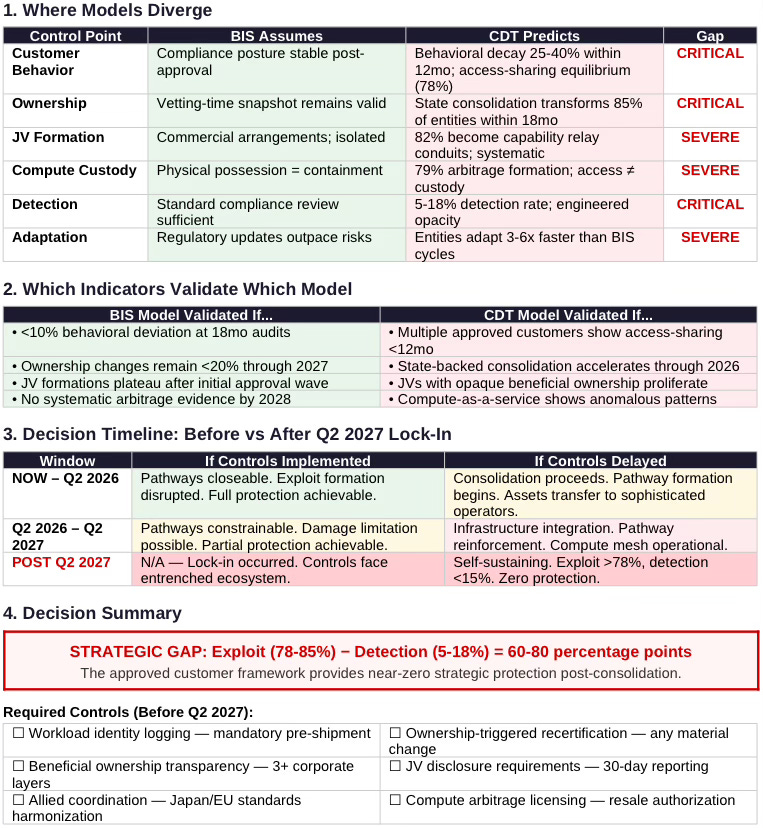
Gap Assessment: The strategic gap widens from 36-65 points to 60-80 points. Post-consolidation, the approved customer framework provides near-zero strategic protection.
Robustness check: Even if exploit and detection estimates are off by 10-15 percentage points in either direction, the ordering (exploit ≫ detection) and widening gap remain. The strategic conclusion does not depend on point precision—it depends on the persistent asymmetry between capability to exploit and capacity to detect.
A 60-80 point gap between exploit formation and detection capacity renders the current framework strategically useless. The policy implications follow directly.
V. Policy and Strategic Implications
Consolidation creates a more dangerous adversary, not a weaker one. Controls designed for a fragmented, chaotic ecosystem will fail against concentrated, state-coordinated, technically competent operators.
If Allies Misread Consolidation as Collapse
Interpreting consolidation as weakness produces specific policy failure modes:
Bureau of Industry and Security / EU regulators delay workload-identity logging, assuming reduced demand
Japan / EU relax compute-access harmonization due to perceived Chinese retrenchment
Export reviews focus on volume instead of orchestration
Cloud resale and compute arbitrage remain lightly regulated
Controls arrive after consolidation lock-in (post-Q2 2027)
The strategic risk is not that controls fail because China is strong, but that controls are delayed because China is misread as weak.
For U.S. Policymakers
Required Actions (2025-2026 Window):
Workload identity logging: Mandatory before H200 shipments, not after. Standardized formats compatible with cross-provider analysis
Beneficial ownership transparency: Trace through state-adjacent capital structures, not just PE funds. Require disclosure through at least three corporate layers
Ownership-triggered recertification: Any material ownership change involving consolidated entities triggers automatic reapproval process
Allied coordination: Harmonize compute-access standards with Japan/EU before consolidated players exploit regulatory arbitrage
JV disclosure requirements: Mandate reporting of all JV formations by approved customers within 30 days, with beneficial ownership mapping
For U.S. AI Firms
The commercial opportunity in China exists only through controlled compute architectures with full observability. Hardware sales into the consolidated market create unmanageable compliance exposure.
Strategic Imperatives:
Vertical integration: Shift from chip sales to compute-as-a-service under direct operational control
Distributor rationalization: Immediate review of any distributor with exposure to Chinese consolidation
Identity-anchored compute: Implement before 2026-2027 regulatory hardening
Distressed asset monitoring: Track approved customer acquisitions of failed Chinese data centers
VI. Falsification Conditions and Timeline
Rigorous foresight requires explicit falsification conditions. The following observations would indicate the CDT model has failed and the BIS static compliance model is correct.
Model Falsification Triggers
By Q4 2026: If <30% of approved customers show behavioral deviation from vetting-time posture, the Drift pathway prediction fails
By Q2 2027: If state-backed consolidation of approved entities remains <40%, the Ownership Transformation pathway prediction fails
By Q4 2027: If JV formations by approved customers remain isolated rather than systematic, the JV Intermediation pathway prediction fails
By Q2 2028: If no evidence of professional compute arbitrage operations emerges, the Arbitrage pathway prediction fails
By Q4 2028: If enforcement detection rates exceed 35% across pathways, the Detection probability predictions fail
Lock-In Point
The simulation identifies Q2 2027 as the lock-in point—the moment after which pathway formation becomes self-sustaining regardless of subsequent control implementation. Prior to lock-in, access-layer controls can substantially close exploit pathways. After lock-in, the parallel capability ecosystem operates outside formal export architecture.
VII. Conclusion
MIT Technology Review reporting documents a coordination failure that, paradoxically, accelerates the strategic threat. China’s chaotic data center buildout was inefficient at converting capital into capability—capital destruction exceeded capability formation. The consolidation now underway will prove efficient—state-coordinated, technically competent, strategically focused.
Cognitive Digital Twin execution reveals a consistent pattern across all five Vision Functions: consolidation improves Chinese internal coherence while degrading external detectability. Pre-consolidation, the ecosystem posed minimal strategic threat because incoherence prevented capability formation. Post-consolidation entities will pose maximum strategic threat precisely because coherence enables capability formation.
H200 ‘approved customer’ framework proved inadequate before consolidation. After consolidation, it becomes actively dangerous—a credentialing system that legitimizes capability transfer to state-coordinated entities operating sophisticated compliance theater. Four exploit pathways identified in prior analysis now operate as a reinforcing system through shared consolidated infrastructure.
Effective intervention window closes Q2 2027. Controls implemented before lock-in can substantially close exploit pathways. Controls implemented after lock-in face a parallel capability ecosystem operating outside formal export architecture.
The gate without the fence is now guarded by professionals. The window is closing faster than anticipated.
MIT captured the transition phase; CDT models the endpoint.
Treating the transition as the endpoint is the error this analysis seeks to prevent.
The task for regulators is to act as if the endpoint is coming—unless the falsification conditions prove otherwise.
Appendix
CONTROL FAILURE MAP
H200 Approved Customer Framework: BIS Assumptions vs CDT Predictions
The gate without the fence is now guarded by professionals.