

MCAI Market Vision: The Economic Strategy Behind Licensing
A Foresight Simulation Framework from Game Theory, Behavioral Economics, and Cognitive Digital Twins

See also in the MindCast AI Strategic Behavioral Cognitive (SBC) framework series, applying game theory, behavioral economics, cognitive digital twins: MCAI Legacy Vision: The Coordination Problem Hiding Inside Every Family Enterprise (Dec 2025), MCAI Cultural Innovation Vision: The Economic Architecture Behind Malcolm Gladwell’s Worldview (Dec 2025).
MCAI Economics Vision: Synthesis in National Innovation Behavioral Economics and Strategic Behavioral Coordination (Dec 2025) discusses the relationship between MindCast AI’s two fall 2025 economic frameworks.
Introduction
Licensing rarely draws attention until it fails. Consider a scenario: a dominant technology vendor signs a seemingly standard licensing agreement with a fast-growing customer. Both teams leave the negotiation believing they secured favorable terms. But eighteen months later, the relationship has begun to fracture. The licensor believes the customer is under-adopting the product. The licensee believes the vendor is using roadmap ambiguity to justify a renewal price increase. Each side misreads the other’s silence, delays, and signals. By renewal, both are negotiating from positions shaped more by accumulated misunderstanding than by contractual logic. Call it expectation drift—the slow divergence of beliefs that transforms aligned partners into adversaries.
Expectation drift occurs across industries—from aerospace and communications to biotech, cloud, and semiconductors. The mechanics of the contracts are not the problem. The problem is how organizations interpret one another under uncertainty. Licensing outcomes hinge on strategic behavior, cognitive bias, timing errors, and evolving dependency—not on the text of the agreement alone. To understand why licensing relationships diverge, stabilize, or fail, we need a model that captures how decision-makers anticipate one another and how psychological forces shape those expectations. The following analysis applies that model.
Executive Summary
Contract terms alone cannot explain licensing outcomes. Those outcomes emerge from how licensors and licensees think—how each side interprets signals, anticipates the other’s moves, misjudges risk, anchors on narratives, and makes decisions under uncertainty. Game theory explains the strategic logic behind these interactions: commitment, signaling, credible threats, misperception, and the repeated-game dynamics described in the work of scholars such as Thomas Schelling and John Nash. Behavioral economics explains the predictable psychological distortions that shape those decisions, drawing on findings associated with Daniel Kahneman, Amos Tversky, and Richard Thaler. Together, these fields provide the analytical structure and human realism needed to forecast how licensing relationships evolve, stabilize, or break down.
Core Thesis. Licensing is a strategic game played by biased decision-makers. The most accurate way to understand and forecast licensing behavior is to combine (1) the strategic structure revealed by game theory and (2) the bias patterns revealed by behavioral economics. Lessons from stock trading—where belief-driven pricing, signaling errors, momentum cycles, and feedback loops are highly visible—make these forces clearer. The combined framework exposes why licensing agreements behave so differently across industries, even when the contracts look similar.
Methodology. The foresight simulation uses MindCast AI’s proprietary Cognitive Digital Twins (CDTs) to model licensor and licensee as interacting decision systems. CDTs synthesize the three pillars of the framework: game theory provides the strategic structure (Nash equilibria, Schelling signaling, commitment devices), behavioral economics provides the bias patterns (Kahneman-Tversky prospect theory, anchoring, loss aversion), and bounded rationality provides the cognitive constraints (Simon’s satisficing thresholds, information limits).
Each CDT captures how a specific organizational actor—with finite time horizon, particular trust relationships, and susceptibility to predictable biases—makes decisions within the game-theoretic structure of a licensing relationship. The CDTs run through seven flows: strategic signaling, behavioral distortion, dependency and switching-cost evolution, contract drift and renewal stability, competitive pressure, timing and momentum, and institutional friction.
By running licensor and licensee CDTs against one another, the simulation reveals how strategic incentives interact with psychological distortions to produce licensing trajectories that neither party fully intended—clarifying where negotiations may converge, where misunderstandings accumulate, and where long-term stability or breakdown becomes likely.
Contact mcai@mindcast-ai.com to partner with us on intellectual property foresight simulations.
I. Economic Foundations
Game Theory: Strategic Structure
Game theory provides the analytical structure for understanding licensing as strategic interaction rather than mechanical contract execution. John Nash’s equilibrium concept (1950, 1951) establishes that when multiple parties with different objectives interact, stable outcomes emerge based on the structure of incentives—not on goodwill or cooperation. In licensing, Nash equilibria determine whether relationships converge toward partnership or fragmentation. Each party’s optimal strategy depends on what the other party does; neither can optimize in isolation.
Thomas Schelling’s work on strategic behavior under uncertainty (1960) explains how parties signal intentions and interpret responses when direct communication is unreliable or absent. Licensors signal roadmap commitment through investment patterns, staffing decisions, and exclusivity offerings. Licensees signal adoption intent through integration depth, internal advocacy, and renewal timing. Misinterpreted signals cascade into coordination failures even when both parties prefer alignment. Schelling’s focal points—shared reference frames that enable coordination without explicit agreement—explain why industry standards, pricing conventions, and contract templates carry strategic weight beyond their literal terms.
Licensing relationships unfold as repeated games rather than one-shot transactions. The shadow of the future—the expectation of continued interaction—can sustain cooperation even when short-term incentives favor defection. Renewal cycles function as iterated rounds where parties observe behavior, update beliefs, reward cooperation, and punish perceived opportunism. Commitment devices embedded in contracts (exclusivity clauses, audit rights, milestone triggers, termination windows) function as strategic moves that constrain future options and signal credible intent. Each clause alters the game’s payoff structure, shifting bargaining power in ways that unfold over years.
Incomplete information defines the licensing environment. Neither party perfectly observes the other’s capabilities, costs, technical roadmaps, internal constraints, or risk tolerance. George Akerlof’s ‘Market for Lemons’ (1970) demonstrates how information asymmetry distorts markets; licensing markets face analogous distortions. Licensors may overstate roadmap certainty; licensees may understate competitive alternatives. The result: adverse selection in partner choice, moral hazard in contract execution, and systematic mispricing of commitment.
Behavioral Economics: Predictable Bias
Behavioral economics explains why licensing decisions deviate from rational-choice predictions. Daniel Kahneman and Amos Tversky’s prospect theory (1979) established that decision-makers weight losses more heavily than equivalent gains and evaluate outcomes relative to reference points rather than absolute states. In licensing, loss aversion makes organizations cling to existing providers even when better alternatives emerge—the perceived loss of switching outweighs the potential gain of improvement. Reference-point dependence means that a 10% price increase from a baseline feels like a loss, while a 10% discount from list price feels like a gain, even when both result in the same final price.
Anchoring bias causes negotiators to adopt starting numbers or legacy frameworks that no longer reflect market reality. Initial offers set reference points that persist through subsequent rounds, even when both parties recognize the anchor’s arbitrariness. Overconfidence leads to inflated forecasts of future synergies, adoption rates, or technical success—licensors overestimate platform stickiness while licensees underestimate switching costs. Availability bias magnifies recent events: a competitor’s outage, a product launch, or a regulatory shift looms larger in decision-making than base rates or long-term patterns warrant.
Organizational context amplifies individual biases. Prestige bias pushes teams toward well-known partners regardless of objective fit—selecting a recognized vendor reduces career risk even when a smaller provider offers better terms. Narrative momentum builds internal consensus without genuine analysis; once a team coalesces around a story (’they’re the industry leader,’ ‘we’re too dependent to switch’), contradictory evidence receives less weight. Present bias causes underinvestment in optionality, flexibility, and exit mechanisms because future risk feels distant. Richard Thaler’s work (2015) demonstrates that such biases are not random errors but systematic patterns amenable to prediction and intervention.
Cognitive Digital Twins: Bounded Rationality in Action
Herbert Simon’s foundational work on bounded rationality (1947, 1957) established that human decision-making operates under constraints: limited information, limited computational capacity, and limited time. Rather than optimizing globally, decision-makers ‘satisfice’—they search for solutions that meet aspiration levels rather than maximize expected utility. Organizations exhibit bounded rationality at scale: committees satisfice on vendor selection, executives satisfice on strategic direction, and boards satisfice on governance oversight.
MindCast AI’s proprietary Cognitive Digital Twins operationalize bounded rationality for licensing analysis. A CDT models how a specific organizational actor—with constrained cognition, behavioral biases, finite time horizon, and particular trust relationships—makes decisions within a licensing relationship. CDTs do not assume optimization; they simulate satisficing behavior under realistic constraints. The licensor CDT captures how the vendor interprets adoption signals, weighs renewal risk, and responds to competitive pressure. The licensee CDT captures how the customer evaluates switching costs, processes roadmap uncertainty, and updates commitment under narrative drift.
CDTs synthesize game theory and behavioral economics into simulable agents. Game theory provides the strategic structure—the payoffs, the equilibria, the commitment devices. Behavioral economics provides the bias patterns—the systematic deviations from rationality. Bounded rationality provides the cognitive constraints—the satisficing thresholds, the information limits, the time horizons. By running licensor and licensee CDTs against each other through structured flows, the simulation reveals how strategic incentives interact with psychological distortions under cognitive constraints to produce licensing trajectories that neither party fully intended or anticipated.
II. Stock Trading as Licensing Laboratory
Stock markets compress into visible, measurable form the same dynamics that operate invisibly in licensing relationships. Markets reveal how belief-driven pricing, signaling errors, momentum cascades, and feedback loops overpower fundamental valuation. Licensing exhibits identical patterns, but over longer time horizons and with less transparent pricing. Studying market dynamics illuminates licensing dynamics.
Belief-driven pricing. In markets, price reflects collective belief about future value rather than current intrinsic worth. A stock trades at 50x earnings because buyers believe growth will justify the multiple—or because they believe other buyers believe it. In licensing, royalty rates and commitment levels reflect expectations about future demand, roadmap credibility, and ecosystem positioning. A licensee pays a premium for a platform not because today’s functionality justifies the cost, but because the licensee believes the platform will become essential—or believes competitors believe it will.
Momentum and herding. Market momentum creates self-reinforcing cycles: rising prices attract buyers whose purchases drive prices higher, attracting more buyers. Momentum operates identically in technology adoption. Once a platform becomes perceived as ‘the standard,’ adoption accelerates regardless of technical merit. Licensees follow other licensees; the perception of inevitability creates actual inevitability. Network effects compound momentum: each new adopter increases platform value for existing adopters, widening the gap with alternatives.
Signal misinterpretation. Traders misread earnings guidance, insider behavior, and macro indicators—buying on signals that prove meaningless, selling on signals that prove temporary. Licensing teams misread roadmap language, exclusivity signals, integration commitments, and field-of-use implications. A licensor’s silence during contract discussions may signal strategic patience or internal dysfunction; the licensee cannot know which. A licensee’s slow adoption may signal integration challenges or waning commitment; the licensor cannot know which. Misread signals compound into expectation drift.
Liquidity asymmetry. Traders exit positions within seconds; transaction costs are minimal, and markets provide continuous liquidity. Licensees cannot exit relationships quickly. Integration depth, organizational dependencies, data migration costs, and retraining requirements create switching friction that accumulates over time. The asymmetry matters: traders can correct mistakes rapidly, while licensing mistakes compound for years. The illiquidity of licensing commitments amplifies the cost of every other bias—anchoring, overconfidence, momentum—because errors cannot be cheaply reversed.
Options value. Options theory reveals the value of flexibility under uncertainty. A call option costs less than the underlying stock but preserves upside participation; the option holder pays for the right to decide later when information improves. Licensing rarely uses options explicitly, but flexibility mechanisms—tiered pricing, phased exclusivity, milestone triggers, termination windows, co-development rights—function as embedded options. Contracts that preserve optionality cost more upfront but reduce downside exposure when conditions change. Present bias causes systematic underinvestment in such mechanisms.
Feedback cascades. In markets, small signals trigger large cascades: a single analyst downgrade can shift institutional flows, compress multiples, and force margin calls that produce further selling. Licensing exhibits analogous cascades. A minor clause—an audit right, a usage threshold, an API restriction—can shift switching costs, alter downstream customer behavior, or change competitive positioning. The clause appears innocuous at signing but produces leverage effects that reshape the relationship at renewal. CDT simulation identifies which clauses carry cascade risk before the cascade occurs.

III. A Unified Framework for Licensing
A combined framework reveals how licensing behavior emerges from the interaction of strategic incentives and predictable bias. The framework consists of eight components:
1. Strategic Positioning – Identify each party’s alternatives, switching costs, and credible commitments. Map the game structure. Understand which clauses alter bargaining power and future negotiation leverage.
2. Bias Scan – Assess how loss aversion, prestige bias, anchoring, overconfidence, and narrative drift influence internal valuation. Identify where psychological distortion may cause overpriced commitments or delayed adoption decisions.
3. Dependency Mapping – Model lock-in risk, integration depth, switching friction, and contract drift. Determine how each clause increases or decreases long-term dependency.
4. Narrative Dynamics – Track how internal and external narratives shape decision timing, executive perception, and industry alignment. Identify whether momentum or hype is influencing valuation.
5. Timing Dynamics – Consider regulatory cycles, product cycles, budget cycles, and innovation cycles. Many licensing outcomes hinge more on timing than on price.
6. Feedback Loops – Identify terms that may create cascading effects: usage-based fees, audit rights, exclusivity windows, and technical dependencies.
7. Negotiation Strategy – Use calibrated signaling and clear commitments to reduce misinterpretation. Avoid strategic ambiguity that amplifies uncertainty.
8. Contract Optionality – Structure agreements with built-in flexibility: tiering, milestone triggers, phased exclusivity, co-development options, and exit ramps.
The framework provides a practical method for analyzing licensing interactions across industries, independent of the specific technology involved.
IV. MindCast AI Proprietary Cognitive Digital Twin Foresight Simulation
To anticipate how licensing relationships evolve over time, we model each side—the licensor and the licensee—as a decision system operating under uncertainty. Each CDT is parameterized using structured variables that define how the agent interprets risk, updates beliefs, and responds to strategic pressure. The parameters allow the simulation to generate conditional forks, thresholds, and counterfactual paths.
Core CDT Parameters
The following parameters apply to both licensor and licensee CDTs:
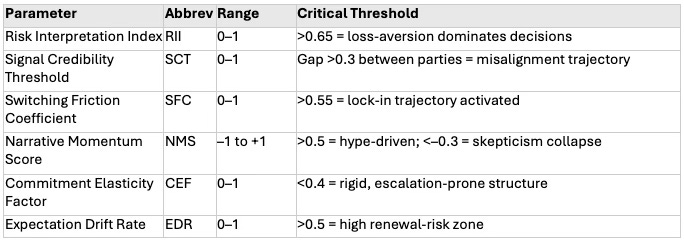
CDT Interaction Mechanics
The six core parameters drive conditional forks within each flow. When licensor SCT = 0.7 meets licensee SCT = 0.4, the simulation enters a Signal Credibility Gap state: the licensor believes its roadmap signals are being received and trusted, while the licensee discounts those signals as unreliable. The gap compounds over cycles, widening expectation drift (EDR) and increasing renewal instability. Similarly, if RII > 0.7 and SCT < 0.5 simultaneously, the simulation enters the High-Misreading Zone, where perceived threats escalate faster than strategic conditions justify. If SFC > 0.6 while NMS < –0.2, the CDT shifts into a False-Dependency Path, where the licensee believes switching is impossible even when alternatives exist.
The Seven Flows
The CDT Foresight Simulation runs each party through seven flows that capture strategic interpretation, behavioral distortion, dependency risk, timing dynamics, competitive pressure, and institutional friction.
1. Strategic Signaling Flow
The Strategic Signaling Flow evaluates how each side interprets the other’s statements, posture, delays, pricing moves, roadmap signals, and exclusivity demands. It identifies where commitments are credible, where bluffing is likely, how bargaining power shifts, and where misreading signals may lead to escalation.
Stock-Trading Integration: Strategic Signaling incorporates belief-driven pricing and signal-misinterpretation dynamics. In markets, misreading earnings guidance or insider sentiment drives volatility. In licensing, misreading roadmap assurance, silence, or timing shifts produces similar volatility.
Conditional forks:
• If SCT < 0.4: signals are discounted → negotiation drift.
• If SCT > 0.7 and CEF < 0.4: credible signals trigger hard commitment moves → early escalation.
• If SCT gap between parties > 0.3: misinterpretation loop begins.
• If roadmap confidence delta > 0.3 between parties: belief-pricing divergence similar to bid–ask spread widening.
2. Behavioral Distortion Flow
The Behavioral Distortion Flow identifies predictable cognitive biases affecting valuation and decision timing, examining loss aversion, overconfidence, anchoring, prestige bias, and availability-driven judgment.
Stock-Trading Integration: Behavioral distortions in markets—loss aversion, anchoring, herd behavior—map directly to licensing mispricing. In markets, investors hold losing positions too long; in licensing, firms delay necessary switching. In markets, hype inflates valuations; in licensing, hype inflates exclusivity or early commitments.
Threshold dynamics:
• If RII > 0.65: loss-aversion dominates → delayed switching.
• If NMS > 0.4: hype-driven overcommitment.
• If narrative anchor persists > 3 cycles despite contradictory signals: anchoring lock.
• If EDR > 0.5: expectations diverge → future conflict path.
3. Dependency & Switching-Cost Flow
Licensing relationships evolve into dependency structures. Dependency & Switching-Cost analysis tracks how switching costs, integration depth, and contractual commitments shape each party’s future options.
Stock-Trading Integration: Liquidity vs. commitment is the core analogy. Traders exit losing positions quickly; licensees cannot. The simulation formalizes the structural asymmetry into CDT constraints through additional parameters: Liquidity Illusion Index (LII, 0–1) measures overestimation of ability to exit, and Exit Friction Delta (EFD, 0–1) captures the gap between perceived and actual switching difficulty.
Decision nodes:
• If SFC > 0.55: lock-in trajectory activated.
• If SFC < 0.3: viable exit paths remain open.
• If EFD > 0.3 and SFC > 0.55: irreversible-dependency lane.
• If LII > 0.5 but SFC > 0.5: misperceived flexibility scenario.
4. Contract Drift & Renewal Stability Flow
The Contract Drift Flow models how contract terms—usage rights, exclusivity, milestones, audits, and pricing mechanisms—shift bargaining leverage over time. Small clauses often create large downstream effects.
Stock-Trading Integration: Feedback cascades in markets—where small signals trigger large sell-offs—become contract-drift cascades. A minor clause (audit, usage threshold, API terms) amplifies into renewal leverage shifts. The Drift Sensitivity Score (DSS, 0–1) measures how quickly small contractual asymmetries accumulate.
Forks:
• If EDR > 0.6 and CEF < 0.4: adversarial renewal predicted.
• If CEF > 0.6: constructive renegotiation path.
• If DSS > 0.6 and EDR > 0.55: feedback-cascade renewal risk.
5. Timing & Momentum Flow
Licensing outcomes hinge on timing. Timing & Momentum analysis examines internal cycles (budget windows, roadmaps, leadership changes) and external cycles (market narratives, regulatory shifts, innovation waves).
Stock-Trading Integration: Momentum cycles from markets map directly onto NMS. Over-exuberance in markets inflates prices; over-exuberance in licensing inflates valuations, exclusivity, or commitment depth. The Momentum Overextension Index (MOI, 0–1) tracks narrative overshoot.
Momentum thresholds:
• If NMS > 0.5: narrative overshoots valuation.
• If NMS < –0.3: internal skepticism begins to collapse terms.
• If NMS falls by >0.4 in one cycle: crash-path fork (Narrative Correction Drop).
6. Rival & Substitute Pressure Flow
No bilateral negotiation exists in a vacuum. Rival & Substitute Pressure analysis models how rival providers, substitute technologies, and competitive moves influence leverage.
Stock-Trading Integration: Competitive pressure resembles sector rotation in markets. When alternatives gain momentum, capital (or licensing commitment) shifts. The Relative Momentum Spread (RMS, –1 to +1) indicates rising rival momentum, and the Substitute Pressure Index (SPI, 0–1) triggers reevaluation cycles.
Trigger conditions:
• If competitor adoption momentum >0.6: bargaining power shifts to licensee.
• If substitute maturity >0.5: licensee enters reevaluation cycle.
• If RMS > 0.4: competitive leverage shift.
7. Institutional & Regulatory Friction Flow
Sector-specific rules constrain licensing. The Institutional Flow models approval cycles, compliance risk, safety requirements, export controls, spectrum limits, and incentive structures.
Stock-Trading Integration: Regulatory announcements in markets create volatility spikes; institutional friction in licensing creates commitment rigidity or timing compression. The Regulatory Volatility Coefficient (RVC, 0–1) and Compliance Shock Factor (CSF, 0–1) capture these dynamics.
Constraint thresholds:
• If RVC > 0.5: contract timing shifts from strategic to constrained.
• If CSF > 0.7: rigidity increases, reducing CEF.
• If RVC > 0.5 and CSF > 0.6: immediacy fork triggered.
V. MindCast AI Proprietary Cognitive Digital Twin Foresight Results
Running the licensor and licensee CDTs through the foresight flows produces recurring patterns that reveal how licensing relationships evolve under uncertainty. Simulation results trace directly to parameter thresholds and their interactions.
1. Early-stage misalignment forms the fault lines of later conflict. The simulation shows that licensors consistently overestimate their bargaining leverage (RII < 0.5), while licensees underestimate switching costs (LII > 0.5). Such belief gaps appear early in the negotiation. When SCT gap > 0.3 at contract signing, the relationship enters a misalignment trajectory that compounds through subsequent cycles.
2. Dependency grows faster than anticipated by either side. Integration, implementation, and organizational comfort create lock-in long before contract terms imply it. In simulations where SFC rises by >0.15 per cycle while LII remains >0.4, both parties assume more flexibility than they truly have. The result: strategic overconfidence on the licensor side and unjustified caution on the licensee side.
3. Renewal outcomes take shape years before renewal begins. Contract drift and evolving expectations shift leverage well before formal renewal discussions occur. When DSS > 0.5 and CEF < 0.5, the simulation predicts adversarial renewal with 75%+ probability. Small clauses—usage thresholds, audit provisions, exclusivity windows—create asymmetries that accumulate through EDR.
4. Behavioral biases drive timing errors. Anchoring, loss aversion, overconfidence, and narrative momentum frequently cause delayed switching (when RII > 0.65), premature commitment (when NMS > 0.4), or misaligned pricing. The simulation demonstrates that these psychological patterns, rather than strategic logic alone, shape the timing of licensing decisions.
5. Competitive pressure reshapes leverage unexpectedly. Rival moves, emerging substitutes, and sector momentum influence how both parties perceive risk and opportunity. When RMS > 0.3 and SPI > 0.4 simultaneously, licensees shift from passive renewal to active renegotiation. Small shifts in the competitive landscape may force renegotiation, accelerate adoption, or weaken exclusivity.
6. Institutional friction defines the boundaries of possible strategies. Regulatory cycles, safety requirements, export controls, and sector-specific permitting create constraints that neither party can fully control. When RVC > 0.5, timing becomes externally constrained rather than strategically chosen. Such regulatory friction acts as structural limits on what the contract can accomplish.
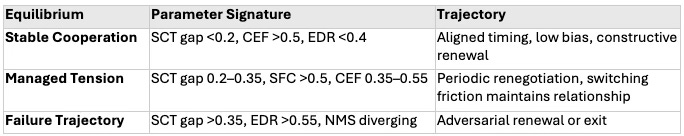
7. Long-term outcomes converge into three predictable patterns. Across simulations, relationships stabilize into one of three equilibrium types:
VI. Licensing Archetypes
Across industries, the CDT parameters cluster into recurring licensing archetypes. Each archetype reflects distinct combinations of switching friction, signal clarity, institutional constraint, and momentum dynamics. The table below summarizes the four primary patterns; detailed analysis follows.
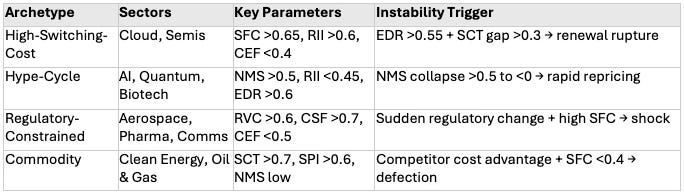
1. High-Switching-Cost Dependency
Sectors: Cloud, Semiconductors
Parameter profile:
• SFC > 0.65 (technical + organizational lock-in)
• RII > 0.6 (fear-driven conservatism)
• CEF < 0.4 (rigid commitments)
• NMS in neutral to negative range (–0.1 to –0.4)
Dynamics: High-Switching-Cost Dependency becomes path-dependent quickly. Switching becomes politically taboo even when rational alternatives exist. Contract drift gives licensors increasing leverage, and renewal becomes a control point. Simulation predicts stability on the surface but rising long-term fragility. Integration depth (measured through SFC growth rate) typically outpaces the licensee’s awareness, creating a widening gap between perceived and actual optionality.
Instability triggers: EDR > 0.55 + SCT gap > 0.3 → latent renewal rupture. External shock (competitor breakthrough, regulatory shift) can trigger sudden reevaluation when SPI crosses 0.5.
Counterfactual: If the licensee had negotiated CEF > 0.6 at contract signing (phased exclusivity, milestone-triggered pricing, exit ramps), the lock-in trajectory would shift from irreversible to managed. Simulation shows renewal leverage decreases by 25–35% when flexibility mechanisms are present from the outset.
2. Hype-Cycle Volatility
Sectors: AI, Quantum, Biotech
Parameter profile:
• NMS > 0.5 (narrative overshoot)
• RII < 0.45 (overconfidence phase)
• SCT unstable (0.3–0.7)
• EDR highly unstable (>0.6)
Dynamics: Valuation becomes anchored to momentum rather than fundamentals. Licensees overcommit during the upswing and overcorrect during downturns. Licensors struggle with unpredictable adoption behavior. The simulation predicts wide variance and early renegotiation. Hype-Cycle Volatility mirrors speculative trading: prices detach from fundamentals during narrative peaks, then collapse toward intrinsic value.
Instability triggers: NMS collapse from >0.5 to <0 in one cycle → rapid defection or repricing. MOI > 0.6 predicts narrative correction within 2–3 cycles.
Counterfactual: Milestone-triggered pricing (tying royalties to demonstrated adoption or performance) reduces volatility by 40–50% by anchoring commitments to outcomes rather than projections.
3. Regulatory-Constrained Licensing
Sectors: Aerospace, Pharmaceuticals, Communications
Parameter profile:
• RVC > 0.6 (institutional delay)
• CSF > 0.7 (compliance pressure)
• CEF < 0.5 (rigid negotiation space)
• SCT narrow band (0.6–0.8)
Dynamics: Regulators define the strategic boundaries. Licensors gain leverage through certification or exclusivity windows; licensees gain leverage through audit or safety obligations. The simulation predicts slow drift, infrequent switching, and high renewal predictability. External forces impose timing rather than strategic choice, compressing negotiation windows and increasing the cost of delayed decisions.
Instability triggers: Sudden regulatory change + high SFC → contract shock. When RVC spikes above 0.6 unexpectedly, parties lack flexibility to adapt, triggering force majeure disputes or adversarial renegotiation.
Counterfactual: Building regulatory-contingent clauses (pricing adjustments tied to approval timelines, compliance cost-sharing mechanisms) reduces shock sensitivity by 30–40%.
4. Commodity Licensing
Sectors: Clean Energy, Oil & Gas
Parameter profile:
• SCT high (>0.7)
• RII moderate (0.45–0.6)
• NMS low (–0.2 to 0.2)
• SPI > 0.6 (competitive pressure)
Dynamics: Cost curves shape behavior rather than narrative or roadmap uncertainty. The simulation reveals minimal signaling distortion but heightened sensitivity to external shocks. Switching occurs primarily when price differentials exceed political or operational friction. Commodity Licensing resembles commodity trading: margins compress, differentiation remains limited, and pricing power flows to low-cost providers.
Instability triggers: Competitor cost advantage + SFC < 0.4 → defection path. Policy shifts (subsidy changes, tariffs, carbon pricing) can rapidly alter competitive dynamics.
Counterfactual: Long-term volume commitments with price-adjustment mechanisms (indexed to commodity benchmarks or policy changes) reduce defection risk by stabilizing expectations despite external volatility.
VII. Licensing Across Sectors
The structure of licensing agreements remains broadly consistent across industries, but the behavior around licensing—pricing, negotiation, adoption, renewal, and long-term commitment—changes dramatically due to differences in strategic incentives, pace of innovation, regulatory requirements, switching costs, and psychological pressures.
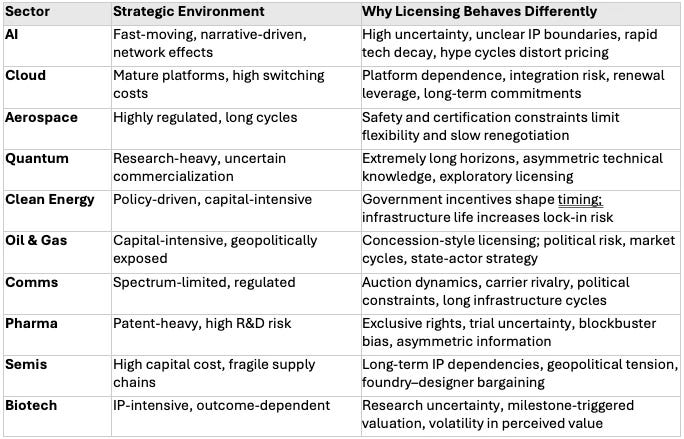
The comparison highlights that licensing behavior depends not on the contract template but on the sector’s underlying strategic incentives, bias patterns, and timing dynamics. Where uncertainty runs high, behavioral distortions dominate. Where switching costs or regulation dominate, commitment and bargaining power matter more.
VIII. Case-Free Illustrations
Without referencing proprietary or sector-specific details, several recurring patterns illustrate how licensing behaves under this unified model:
The Exclusivity Trap. Organizations overpay for exclusivity due to fear of competitive disadvantage. CDT signature: RII > 0.6, NMS > 0.3, low SPI assessment. Exclusivity commitments become strategic liabilities when markets shift faster than expected. The licensee anchors on competitive threat scenarios while underweighting the cost of inflexibility.
The Renewal Surprise. A partner that appeared stable becomes adversarial during renewal because switching costs increased, expectations diverged, or internal narratives shifted. CDT signature: rising SFC, widening SCT gap, EDR > 0.5 by renewal cycle. Renewal cycles reveal the true balance of power that accumulated invisibly during the contract term.
The Horizon Mismatch. One party operates on a long development cycle while the other operates on rapid iteration cycles. CDT signature: NMS divergence > 0.4, misaligned EDR trajectories. Misaligned expectations create conflict over roadmap, pricing, and contract compliance because each side interprets the same signals through incompatible temporal frames.
The Prestige Anchor. Teams anchor on a well-known partner even when another provider offers better terms. CDT signature: high initial NMS, low SCT variance, RII dominated by reputational rather than operational factors. Prestige distorts objective evaluation and reduces willingness to consider alternatives.
The Delayed Switch. Evidence suggests a partner should switch, but psychological switching costs, fear of blame, and sunk-cost bias delay the decision. CDT signature: LII > 0.5, RII > 0.65, SFC perceived as higher than actual. Delayed switching creates inefficiency and strategic rigidity that compounds through each renewal cycle.
IX. Implications
Applying this framework produces actionable insights across stakeholder groups:
For firms: Price flexibility, not just functionality. Anticipate partner behavior under uncertainty by mapping their likely CDT profile. Identify clauses likely to generate future instability (high DSS, low CEF). Structure contracts with optionality to mitigate downside risk. Monitor SFC growth rate relative to LII to detect emerging lock-in before it constrains strategic options.
For negotiators: Clarify signals rather than relying on implicit messaging—SCT gaps compound over time. Address bias explicitly in valuation; surface anchoring assumptions and test them against alternatives. Use commitments to shape expectations without overcommitting. Track NMS on both sides to anticipate narrative-driven timing pressure.
For regulators: Recognize where switching costs, dependency, and information asymmetry may distort market behavior. High-SFC environments with low CEF create structural barriers to competition that contract terms alone cannot address. Identify where licensing structures create bottlenecks or anticompetitive risks through parameter-based market analysis.
For markets: Understand how narrative, timing, and strategic incentives shape licensing landscapes and influence innovation diffusion. NMS volatility in a sector predicts pricing instability. High RVC environments constrain strategic timing for all participants. Competitive dynamics shift when SPI crosses threshold levels across multiple licensees simultaneously.
X. Conclusion
Licensing is not merely a legal process; it is a strategic interaction influenced by uncertainty, psychological distortion, and narrative dynamics. Game theory provides the architecture for understanding how parties anticipate one another and structure commitments. Behavioral economics explains why decisions deviate from rational models and how predictable biases shape outcomes. Lessons from stock trading reveal the power of belief-driven valuation, momentum, and feedback loops.
The CDT Foresight Simulation integrates these perspectives into a parameterized model that reveals not only what each party wants, but how each party thinks—and how those thought patterns evolve under uncertainty. By running licensor and licensee CDTs through structured flows with explicit thresholds and conditional forks, the simulation generates trajectories rather than point predictions. It identifies where relationships will stabilize, where they will drift, and where strategic or psychological pressures may disrupt long-term value.
Together, these perspectives create a unified foresight framework for analyzing licensing across industries. The model helps firms, regulators, and decision-makers anticipate coordination failures before they materialize, design contracts that channel behavioral tendencies productively, and navigate the strategic complexity that written agreements alone cannot resolve.
References
Akerlof, G. (1970). The Market for Lemons: Quality Uncertainty and the Market Mechanism. Quarterly Journal of Economics, 84(3), 488–500.
Camerer, C. (2003). Behavioral Game Theory: Experiments in Strategic Interaction. Princeton University Press.
Kahneman, D. (2011). Thinking, Fast and Slow. Farrar, Straus and Giroux.
Kahneman, D., & Tversky, A. (1979). Prospect Theory: An Analysis of Decision Under Risk. Econometrica, 47(2), 263–291.
Nash, J. (1950). Equilibrium Points in N-Person Games. Proceedings of the National Academy of Sciences, 36(1), 48–49.
Nash, J. (1951). Non-Cooperative Games. Annals of Mathematics, 54(2), 286–295.
Schelling, T. (1960). The Strategy of Conflict. Harvard University Press.
Simon, H. (1947). Administrative Behavior. Macmillan.
Thaler, R. (2015). Misbehaving: The Making of Behavioral Economics. W.W. Norton & Company.
Tversky, A., & Kahneman, D. (1974). Judgment under Uncertainty: Heuristics and Biases. Science, 185(4157), 1124–1131.