

MCAI National Innovation Vision: Foresight Simulation of NVIDIA H200 China Policy Exploit Vectors
Why 'Approved Customer' Creates Predictable Capability Laundering Pathways

Executive Summary
On December 8, 2025, President Trump announced that NVIDIA would be permitted to export H200 AI chips to China in exchange for a 25% surcharge on sales. The decision allows shipments to approved customers vetted by the Department of Commerce, representing a significant reversal from Biden-era restrictions that limited NVIDIA to downgraded H20 chips for the Chinese market. Wells Fargo analysts project the policy could unlock $25-30 billion in annual revenue for NVIDIA, a substantial commercial win. But commercial success and strategic effectiveness are not the same thing.
The Policy Gap
The announced framework permits H200 exports to Commerce-vetted approved customers, collects 25% of sales as a surcharge, and excludes Blackwell and Rubin chips from the arrangement. The framework does not require post-approval monitoring, mandate workload identity logging, impose beneficial ownership transparency beyond initial vetting, restrict compute resale, or establish recertification cycles. The policy creates a gate at the point of sale but builds no fence around what happens afterward. Approved customers receive a credential at vetting time that provides indefinite access regardless of how ownership, operations, or access patterns change.
Four Exploit Pathways
MindCast AI’s Cognitive Digital Twin methodology models four high-probability exploit pathways that emerge from the policy’s structural gaps. Each pathway represents a distinct mechanism through which capability flows to non-allied actors despite formal compliance with the approval framework.
Approved Customer Drift: Approved entities present clean ownership structures and plausible end-use declarations at vetting time. Capital efficiency pressure then shifts incentives toward monetization-sharing access with partners, offering compute to third parties, forming collaborations that extend usage beyond original scope. Behavioral integrity scores decline 25-40% within twelve months. The simulation estimates 62% probability that access-sharing becomes equilibrium behavior within eighteen months, with only 21% probability of enforcement detection within three years.
Private Equity Ownership Transformation: PE introduces structural risks distinct from operational misuse-ownership transformation, incentive compression, and time-horizon arbitrage. PE routinely restructures portfolio companies within 12-24 months, bringing non-allied co-investors, shifting governance rights offshore, installing management with different incentives, and driving revenue-seeking behaviors involving compute resale or technical collaboration. PE-backed entities often become the architects of JV and arbitrage schemes through cross-portfolio resource pooling, side-car vehicles, and foreign LP participation with embedded influence rights. The simulation estimates 74% probability that PE acquisition of an approved customer leads to material compliance degradation within eighteen months, with only 14% probability of regulatory detection before degradation completes.
Opaque Joint Venture Intermediation: Unlike drift, which emerges organically from incentive pressure, JV structures are architected from inception to relay capability while maintaining plausible deniability. An approved customer forms a joint venture through holding companies in jurisdictions with minimal disclosure requirements. The JV never owns chips but receives access rights for ‘collaborative research.’ Beneficial ownership becomes opaque within two or three corporate layers. Causal Signal Integrity falls to the 0.03-0.09 range-indicating chains engineered for non-attribution. The simulation estimates 71% probability that JVs become primary conduits for unauthorized access, with only 9% probability of early detection.
Compute Arbitrage at Scale: Approved customers resell compute capacity as a service to non-approved parties. Unlike physical transshipment, which requires moving hardware and leaves customs trails, compute arbitrage operates at the speed of authentication. Access can be provisioned in minutes, serve thousands of concurrent users, and leave audit trails controlled entirely by the arbitrageur. The economic logic is compelling: 40-60% gross margins on resale, break-even in fourteen to eighteen months. The simulation estimates 68% probability of arbitrage ecosystem formation within eighteen months, with only 26% probability of regulatory catch-up within two years.
Probability Summary
The simulations generate outcome probabilities that quantify strategic risk. Exploit formation probability exceeds 60% across all four pathways: approved customer drift at 62%, PE ownership transformation at 74%, JV intermediation at 71%, and arbitrage ecosystem formation at 68%. Detection and interdiction probability remains below 30% for all four pathways within the relevant timeframes-and falls to single digits for PE acquisition and JV exploits. The gap between exploit probability and detection probability defines the strategic risk the policy accepts: capability will flow through these channels faster than enforcement can identify, investigate, and interdict.
The 2026-2027 Window
The recommended controls-workload identity logging, six-month recertification cycles, beneficial ownership transparency, JV disclosure requirements, resale licensing, multi-agency coordination-could be implemented through regulatory action or legislative mandate within the 2026-2027 window. If implemented, the exploit pathways can be substantially closed before they institutionalize. If not implemented, the parallel capability ecosystem that forms will operate outside formal export architecture. The leakage the original export controls sought to prevent will occur through policy-created channels rather than despite them.
Foundation in Prior Work
The analysis extends MindCast AI’s National Innovation Vision trilogy. ‘The Innovation Trap’ established that technology leakage emerges from institutional drift rather than headline violations. ‘The Department of Justice, China, and the Future of Chip Enforcement’ demonstrated that adversaries exploit delay windows more than legal boundaries. ‘Lessons from Aerospace’ illustrated how joint ventures and cross-border collaboration become strategic pathways for knowledge transfer long before enforcement detects them. The H200 approval validates the trilogy’s core predictions while implementing none of the access-layer controls the trilogy identified as necessary.
Insight: The policy addresses NVIDIA’s market-access problem. It does not address America’s capability-leakage problem. These are not the same problem.
Contact mcai@mindcast-ai.com to partner with us on national innovation policy foresight simulations. See also prior MindCast AI publications referenced in Section I.
I. What the Policy Assumes-and Why Those Assumptions Fail
MindCast AI’s earlier publications form a sequential analysis of how technological incentives, institutional behavior, and regulatory gaps interact to create long-range export-control vulnerabilities. The Innovation Trap (Nov 2025) explained how national innovation systems lose strategic advantage when control regimes focus on static compliance rather than behavioral adaptation, showing how technology leakage emerges from institutional drift rather than headline violations. The Department of Justice, China, and the Future of Chip Enforcement ((Nov 2025) evaluated the misalignment between enforcement timing and technology-transfer velocity, emphasizing that adversaries exploit delay windows more than legal boundaries. Lessons from Aerospace: What High-Velocity Markets Teach About AI Export Risk (Nov 2025) used the aerospace sector to illustrate how joint ventures, supply-chain opacity, and cross-border technical collaboration become strategic pathways for knowledge transfer long before enforcement detects them.
Taken together, these publications establish the behavioral and institutional foundations for the present foresight simulation, which uses Cognitive Digital Twins to model how approved entities drift, how opaque partnerships engineer access, and how compute-resale ecosystems exploit incentive gaps in emerging export regimes. If the ‘approved customer’ framework omits the controls that trilogy identified as necessary, there must be an implicit rationale. That rationale rests on assumptions about how approved customers will behave after hardware arrives. Understanding those assumptions-and why they fail-explains both why the policy was designed as it was and why the exploit pathways modeled in subsequent sections emerge with such predictability.
Every policy embeds assumptions about how actors will behave. The ‘approved customer’ framework assumes three things: that ownership structures remain stable after approval, that end-use declarations at vetting time predict operational behavior, and that physical possession of chips by an approved entity means capability stays with that entity. Static ownership, predictable end-use, and custody-based boundaries would be reasonable assumptions in a world with perfect information. The assumptions fail in a world where ownership mutates, incentives shift, and compute access can be shared instantly across borders.
The announced framework permits H200 exports to Commerce-vetted customers, collects 25% of sales as a surcharge, and excludes Blackwell and Rubin chips from the arrangement. What it does not do is require post-approval monitoring, mandate workload identity logging, impose beneficial ownership transparency beyond initial vetting, restrict compute resale, or establish recertification cycles. The policy creates a gate. It does not create a fence.
The gap between what the policy assumes and what the policy monitors is where exploit pathways form. Approved customers face no ongoing verification. Ownership can change the day after approval. Compute can be resold to any party willing to pay. Joint ventures can be formed with opaque beneficial owners. None of these activities trigger review under the announced framework.
The table below details each control mechanism the trilogy identified, what protective function it would serve, and its status in the announced H200 policy. The pattern is consistent: the policy addresses the transaction but not the capability flow that follows.
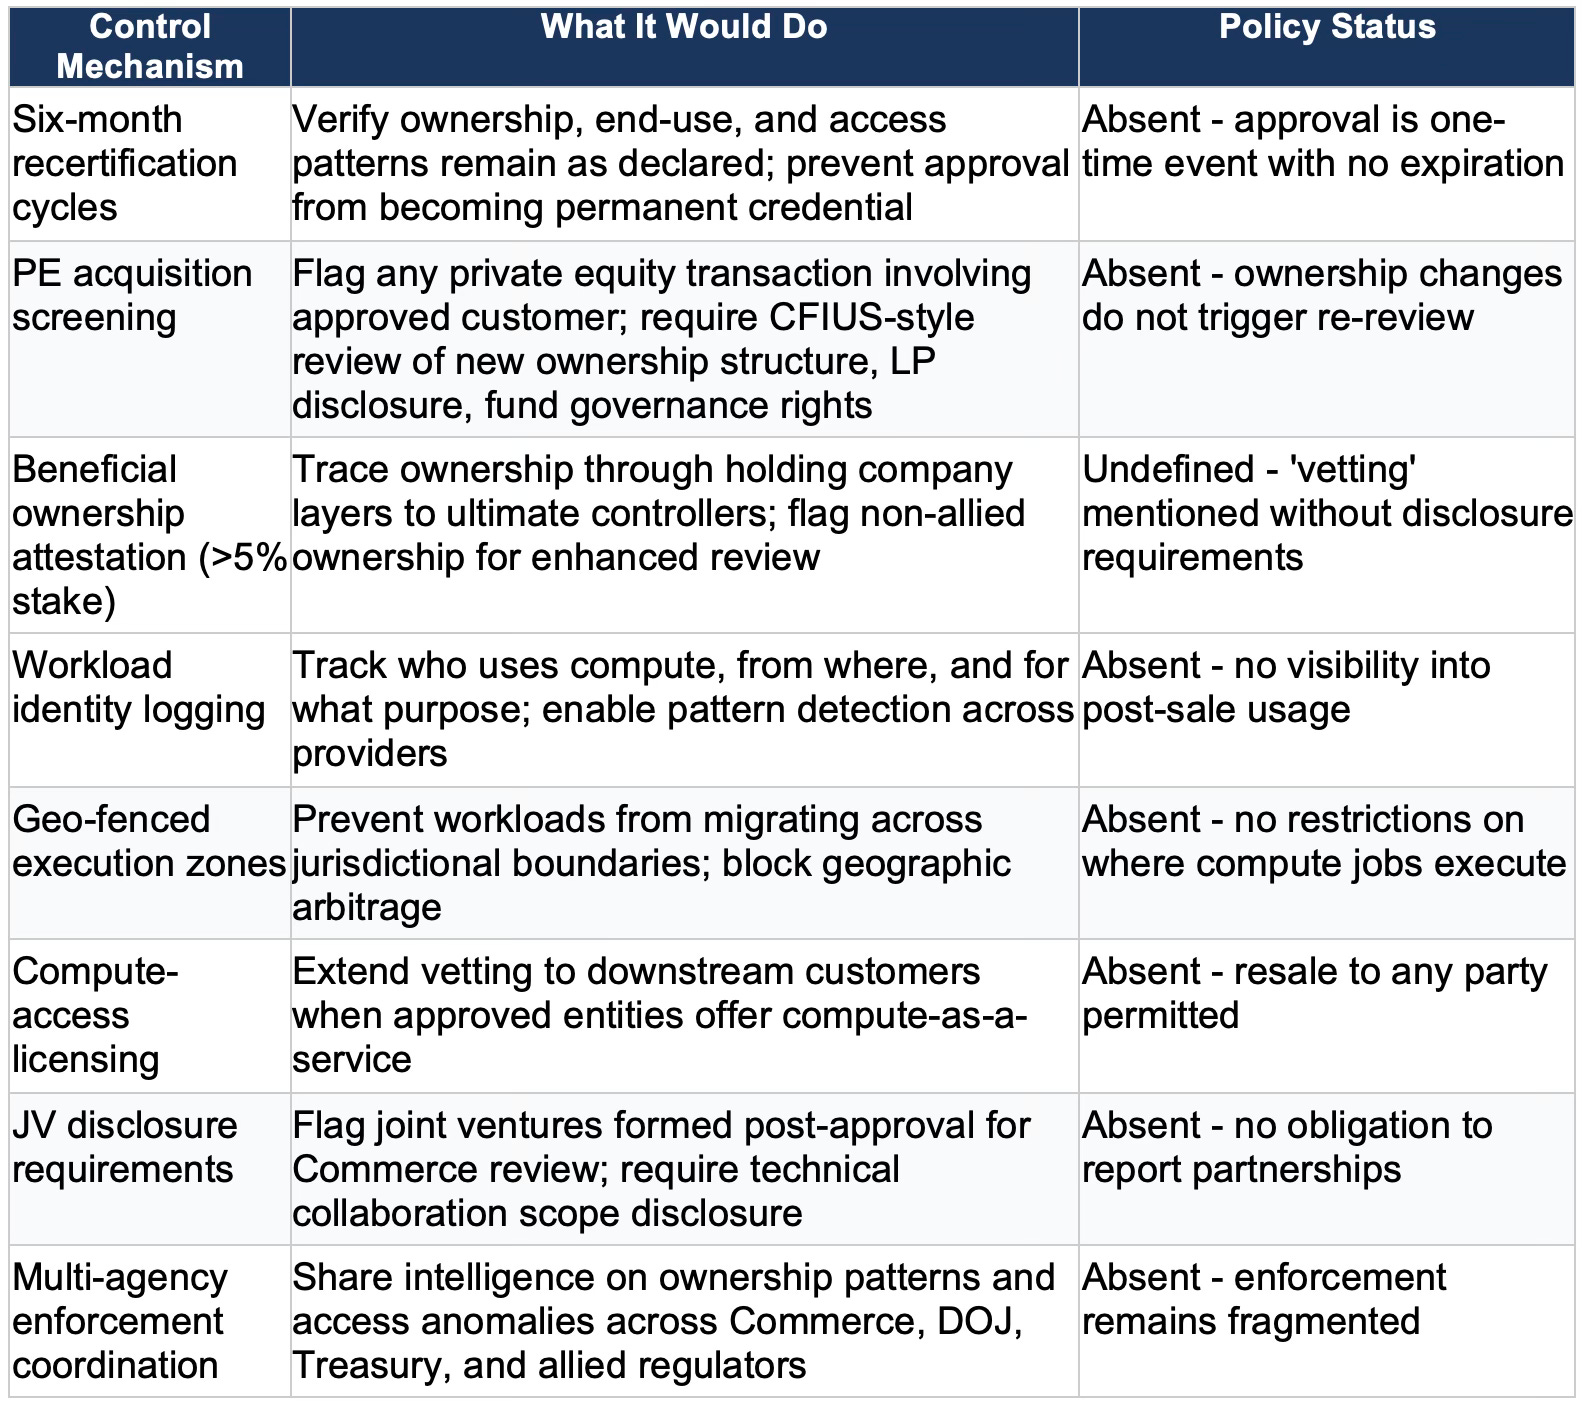
The absence of these controls is not an oversight-it reflects a policy designed for commercial reopening rather than strategic protection. Prioritizing market access over capability governance has consequences. The simulations that follow model what those consequences look like across three distinct exploit vectors.
Insight: A gate without a fence is an entrance, not a barrier. The policy creates the gate. It does not build the fence.
II. How the Simulations Work
MindCast AI’s Cognitive Digital Twin architecture models institutional actors as behavioral systems with measurable signatures. Rather than assuming actors follow their stated intentions, the methodology tracks alignment between what actors say and what they do, how consistently they execute declared processes, and how those patterns propagate through relationships and over time. The goal is not prediction in the deterministic sense but foresight-identifying which behavioral equilibria are likely to emerge given the incentive structures in play.
Each simulation routes signals through a sequence of analytical functions. The process begins with baseline measurements of behavioral integrity, then examines causal chains from incentives to actions, models how quickly institutions adapt to exploit opportunities, and projects how patterns propagate at the national level. The outputs include quantified trust scores, outcome probabilities, and timelines for when specific behaviors are likely to manifest.
Three metrics recur throughout the analysis. Causal Signal Integrity (CSI) measures how traceable a chain of actions remains-scores below 0.10 indicate chains engineered for opacity rather than incidental complexity. Institutional Update Velocity (IUV) measures how quickly an organization changes behavior when exposed to new incentives-high velocity means rapid adaptation. Legacy Inertia Coefficient (LIC) measures how much prior commitments constrain current behavior-low inertia means past promises exert little restraining force. CSI, IUV, and LIC together reveal whether an actor’s compliance posture at approval will persist or decay.
The simulations apply this methodology to three actor profiles: approved customers as they drift from initial compliance, opaque joint ventures designed to relay capability access, and arbitrageurs who resell compute to non-approved parties. Approved customers, JVs, and arbitrageurs each represent a distinct pathway through which the policy’s structural gaps become operational exploits.
Insight: Measuring what actors say is easy. Measuring what they do-and predicting how that diverges over time-is what separates compliance theater from actual control.
III. Approved Customer Drift
The first simulation models what happens to approved customers after hardware arrives in-country. At the moment of Commerce vetting, approved entities present clean ownership structures, plausible end-use declarations, and cooperative postures. They score well on behavioral integrity metrics. The question is whether the clean posture persists-and the simulation indicates it does not.
The drift pattern follows a predictable sequence. During the first four to seven months, approved customers operate largely as declared-internal teams use the H200s for stated purposes, documentation remains consistent, and access stays contained. Then capital efficiency pressure emerges. High-end GPUs sitting underutilized represent losses. The incentive gradient shifts toward monetization: sharing access with partners, offering compute to third parties, forming collaborations that extend usage beyond the original scope. By month nine to fourteen, access-sharing signals cluster. By month eighteen to twenty-four, the approved customer’s operational behavior has diverged substantially from the posture presented at vetting.
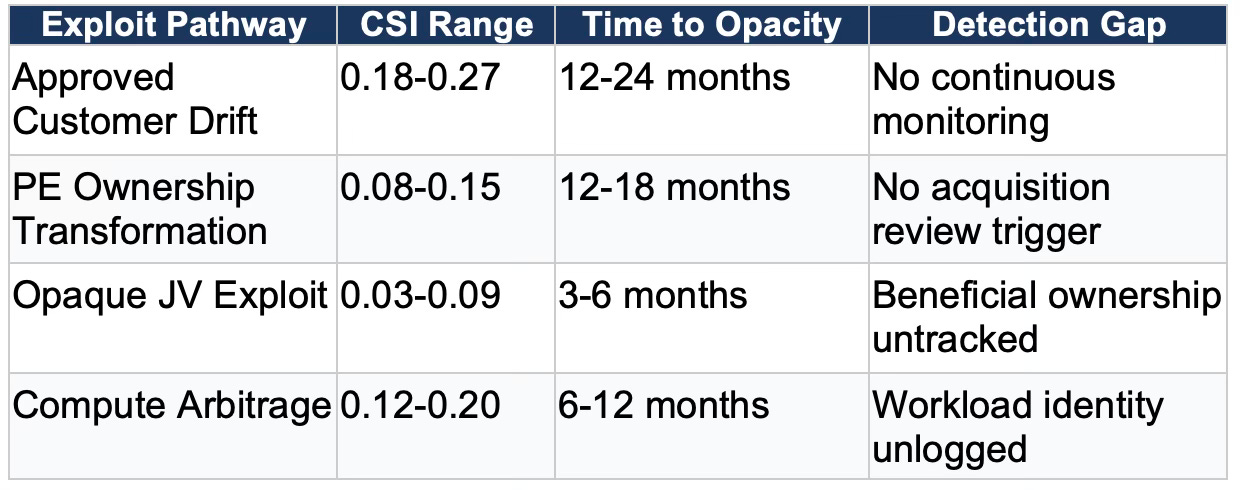
The simulation measures behavioral decay quantitatively. Integrity scores decline 25-40% within twelve months of hardware arrival. Causal Signal Integrity-the traceability of who actually uses the compute-falls to the 0.18-0.27 range, indicating significant opacity. Institutional Update Velocity runs high, meaning approved customers adapt quickly to exploit opportunities. Legacy Inertia runs low, meaning commitments made at approval exert little constraining force on subsequent behavior.
Why Detection Fails
The policy provides no mechanism to observe this drift. There is no mandatory workload logging to reveal who actually runs compute jobs. There is no recertification cycle to verify that ownership and operations remain as declared. There is no access-pattern monitoring to flag when usage shifts from internal R&D to external service provision. The approved customer maintains its credential while its behavior diverges from the basis on which that credential was granted.
The simulation estimates a 62% probability that access-sharing becomes the equilibrium behavior for approved customers within eighteen months. Detection probability runs far lower-only 21% chance that enforcement identifies drift within three years. The gap between those numbers defines the exploit window.
Foresight Outcomes
At twelve months, an identity-obscured resale market begins stabilizing as approved customers discover they can monetize excess capacity without triggering review. At twenty-four months, capability diffuses into non-allied adjacent actors-entities one or two steps removed from the approved customer who could not have obtained direct approval. At thirty-six to forty-eight months, a parallel compute ecosystem operates alongside the formal export architecture, populated by actors who gained access through drift rather than through Commerce vetting.
The intervention levers are straightforward: mandatory workload identity logging, recertification at six-month intervals, and ongoing ownership transparency requirements. None of these controls appear in the announced policy.
Insight: Approval is a photograph. Behavior is a film. The policy captures the photograph and assumes the film matches. It doesn’t.
IV. Private Equity as Ownership Transformation Engine
Private equity introduces structural risks that differ fundamentally from the other actor classes. The risk does not come from operational misuse-approved customers drifting toward access-sharing, JVs architecting capability relay, or arbitrageurs reselling compute. PE risk comes from ownership transformation, incentive compression, and time-horizon arbitrage. Private equity often becomes the silent force that alters an entity’s behavior after export approval, turning a clean buyer into a systemic leakage point without any change in the entity’s nominal identity.
Three dynamics force PE into the simulation as a distinct actor class. First, ownership mutation after approval is the most reliable leakage pathway in the entire system. PE routinely restructures portfolio companies within 12-24 months-bringing non-allied co-investors, shifting governance rights offshore, installing new management with different incentives, and driving revenue-seeking behaviors involving compute resale or technical collaboration. Second, PE operates under incentive gradients that amplify export-control risk: rapid revenue expansion, valuation uplift, short-to-medium exit windows, and weak visibility into ultimate beneficiary ownership. Those incentives push portfolio companies toward compute monetization, affiliate deals, JV structuring, licensing arrangements that look benign, and evasive ownership stacking. Third, PE-backed entities often become the architects of opaque JV and compute arbitrage schemes-not at the operating company level but at the fund or holding-company level through cross-portfolio resource pooling, off-balance-sheet service arrangements, side-car vehicles, and foreign LP participation with embedded influence rights.
The simulation applies five CDT flows to model PE behavior. Causation Modeling identifies whether PE ownership change causes downstream risk behavior rather than merely correlating with it-mapping how incentive-driven structural redesign propagates through portfolio companies. Institutional Cognitive Plasticity measures PE’s extremely high adaptability; PE firms restructure governance faster than regulators adapt, with very high update velocity and structural pruning often used to obscure control chains. Strategic Behavioral Coordination models how PE aligns strategy across all portfolio entities, uncovering synchronized JV formation, cross-portfolio compute routing, and coordinated disclosure patterns. Disclosure Behavior CDT tracks how PE-backed firms selectively reveal ownership changes and technical partnerships, including timed updates around audit cycles and partial disclosures. National Innovation Behavioral CDT identifies national-level propagation when foreign LPs or sovereign vehicles participate in the fund-demand synchronization across multiple portfolio companies, coordinated acquisition of compute capacity, and cross-border knowledge diffusion.
The Ownership Mutation Sequence
The simulation models a characteristic PE acquisition sequence. At T+0, a PE fund acquires controlling stake in an approved customer. The acquisition itself may not trigger any regulatory review-the approved customer’s credential persists, attached to the corporate entity rather than its owners. At T+3 to T+6 months, the PE fund begins operational optimization: new management, revised KPIs emphasizing utilization and revenue per GPU, pressure to monetize underutilized capacity. At T+6 to T+12 months, structural changes emerge: new JV partnerships announced as ‘strategic collaborations,’ compute-as-a-service offerings launched, cross-portfolio resource sharing implemented. At T+12 to T+18 months, the approved customer’s operational behavior has diverged substantially from its vetting-time posture-but its approval credential remains valid, and no mechanism exists to detect the divergence.
The fund structure itself introduces additional opacity layers. The GP manages the fund but may have its own ownership complexity. LPs include institutional investors, sovereign wealth funds, family offices, and potentially non-allied state-adjacent capital. Side-car vehicles allow specific LPs to co-invest in particular deals with enhanced governance rights. Fund-to-fund relationships create attribution breaks-a US-domiciled fund of funds investing in a PE fund that acquires an approved customer introduces multiple layers between ultimate capital source and controlled entity.
CDT Flows for Private Equity
Private equity must be treated as a distinct high-risk actor class requiring its own Vision Function CDT Flow. The risk does not come from operational misuse—it comes from ownership transformation, incentive compression, and time-horizon arbitrage. Private equity often becomes the silent force that alters an entity’s behavior after export approval, turning a clean buyer into a systemic leakage point. Three dynamics force PE into the simulation: ownership mutation after approval is the most reliable leakage pathway in the entire system; PE operates under incentive gradients that amplify export-control risk; and PE-backed entities often become the architects of the opaque JV or compute arbitrage schemes through fund-level structures invisible at the operating company level.
The simulation applies five CDT flows to model PE behavior. Causation Modeling CDT identifies whether PE ownership change is a cause of downstream risk behavior, not a correlation, mapping how incentive-driven structural redesign propagates through portfolio companies. Institutional Cognitive Plasticity CDT measures PE’s extremely high adaptability—PE firms restructure governance faster than regulators adapt, with very high update velocity and structural pruning often used to obscure control chains. Strategic Behavioral CDT models how PE aligns strategy across all portfolio entities, uncovering synchronized JV formation, cross-portfolio compute routing, and coordinated disclosure patterns. Disclosure Behavior CDT tracks how PE-backed firms selectively reveal ownership changes and technical partnerships, including timed updates around audit cycles and partial disclosures. National Innovation Behavioral CDTidentifies national-level propagation when foreign LPs or sovereign vehicles participate in the fund—demand synchronization across multiple portfolio companies, coordinated acquisition of compute capacity, and cross-border knowledge diffusion.
CDT Metrics for Private Equity
The simulation scores PE actors on the standard integrity metrics, with characteristic patterns. Causal Signal Integrity runs 0.08-0.15-low, but not as low as purpose-built JV structures, because PE acquisitions must clear some regulatory hurdles and leave documentary traces. The opacity is structural rather than intentional, emerging from standard fund architecture rather than deliberate obfuscation. Institutional Update Velocity runs extremely high-PE firms restructure governance, management, and strategy faster than any other actor class. Legacy Inertia runs extremely low-commitments made by prior ownership exert zero constraining force on PE-installed management. Incentive Alignment between PE fund economics and export-control compliance runs strongly negative: every PE incentive pushes toward behaviors that increase leakage risk.
The simulation estimates a 74% probability that PE acquisition of an approved customer leads to material compliance degradation within eighteen months. Detection probability runs at only 14%-lower than any other pathway except JV structures. The gap reflects the fundamental mismatch: export controls attach to corporate entities, but PE transforms what those entities do without changing their legal identity.
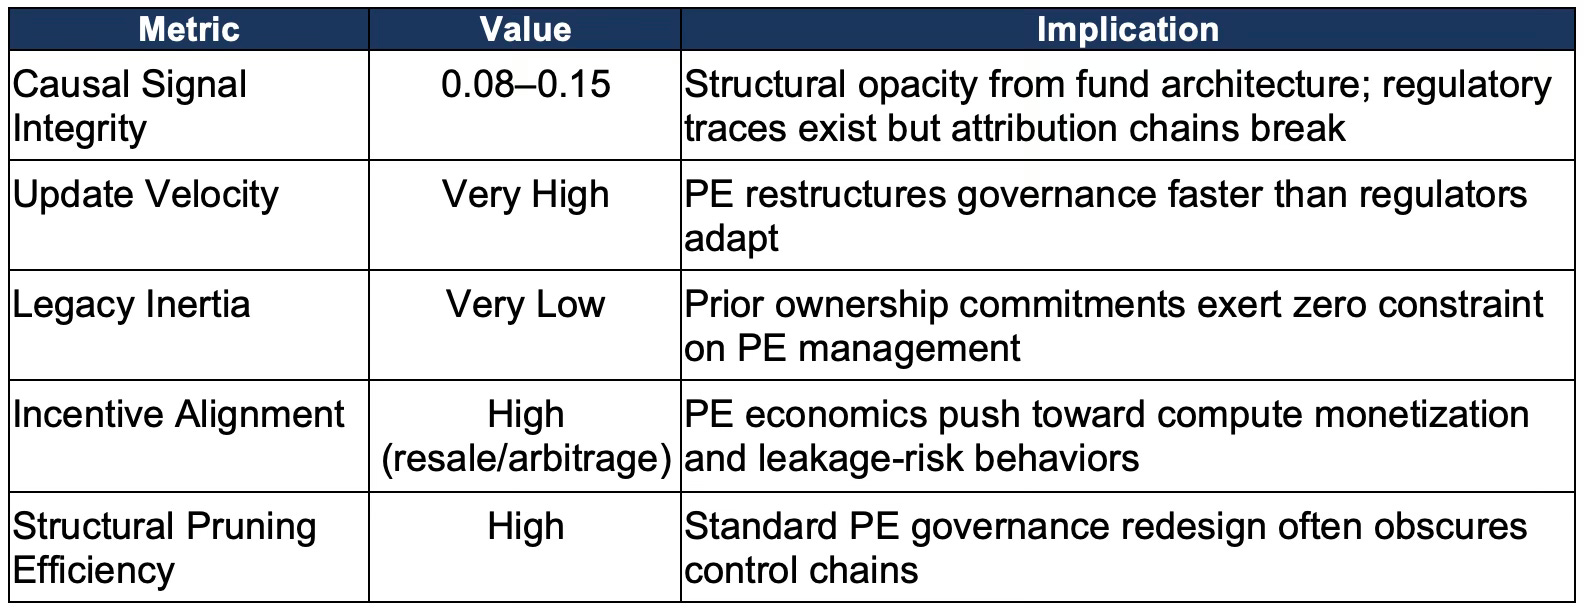
Unlike the other actor classes, private equity metrics are distributed throughout the narrative rather than grouped in a standalone table. This structural choice reflects PE’s upstream role: PE acts as a behavioral amplifier across multiple portfolio companies, so the simulation produces range-based structural forecasts rather than single-actor probability distributions. The key metrics—Update Velocity (very high), Legacy Inertia (very low), Incentive Alignment (high toward resale or arbitrage), and Structural Pruning Efficiency (high)—correspond exactly to those used for approved customers, JVs, and arbitrageurs, but are embedded within the Institutional Cognitive Plasticity narrative because PE behavior is inherently multi-entity and upstream of the other exploit pathways.
Cross-Portfolio Coordination
PE risk extends beyond individual portfolio companies. The Strategic Behavioral CDT identifies coordination patterns across multiple PE-owned entities. A single fund controlling multiple approved customers-or multiple entities in the AI compute supply chain-can implement synchronized strategies invisible at the individual-entity level. Compute capacity can be pooled across portfolio companies and offered as aggregated service. JV structures can be replicated across portfolio with minor variations. Technical collaboration agreements can route knowledge through portfolio company networks. The coordination operates at fund level, leaving each portfolio company’s behavior apparently independent while the aggregate effect constitutes systematic capability transfer.
Foreign LP participation amplifies national-level risk. The National Innovation Behavioral CDT models how sovereign wealth fund investment in PE vehicles creates state-level access to portfolio company capabilities. The LP does not control the fund-but LP agreements often include information rights, co-investment rights, and advisory board seats that provide influence channels. When the portfolio includes approved customers with H200 access, those influence channels become capability-access channels. The policy’s failure to trace beneficial ownership through fund structures leaves this pathway completely unmonitored.
Foresight Outcomes
At twelve months post-acquisition, PE-owned approved customers show measurable behavioral divergence from vetting-time baselines: increased utilization pressure, new partnership structures, compute-sharing arrangements framed as efficiency optimization. At eighteen months, the structural changes crystallize: JV formations, resale offerings, cross-portfolio coordination mechanisms. At twenty-four to thirty-six months, the PE-transformed entity operates as a fundamentally different actor than the one Commerce approved-same legal identity, different ownership, different incentives, different behavior. The approval credential persists throughout.
The simulation generates probabilistic forecasts for PE-driven exploit formation: diversion probability (likelihood that PE restructuring creates unauthorized access pathways) runs 68–74% within eighteen months; knowledge-transfer dominance probability (likelihood that PE-coordinated channels outpace direct hardware diversion) runs 61% by twenty-four months; detection likelihood (probability that enforcement identifies PE-driven degradation before completion) runs only 14%. These probabilities reflect PE’s role as a behavioral amplifier—PE does not create single-actor exploits but enables and accelerates the other three pathways through ownership transformation and cross-portfolio coordination.
Intervention requires mandatory notification of any PE transaction involving approved customers, CFIUS-style review of new ownership structures including LP disclosure and fund governance analysis, and automatic recertification triggered by material ownership change. The announced policy includes none of these mechanisms.
Insight: Export controls attach to corporate shells. Private equity transforms what lives inside those shells. The policy monitors the container while PE replaces the contents.
V. The Opaque Joint Venture Pathway
Behavioral drift emerges organically from incentive pressure-approved customers don’t set out to violate their commitments, but capital efficiency logic gradually pulls them toward access-sharing. The joint venture pathway operates differently. JV structures are architected from inception to relay capability while maintaining plausible deniability. Where drift represents compliance erosion, the JV pathway represents compliance circumvention. Both exploit the absence of post-approval monitoring, but through fundamentally different mechanisms.
The second simulation models deliberate exploit architecture: joint ventures structured specifically to transfer compute access or knowledge to parties who could not obtain direct approval. JVs exploit the gap between the approved customer’s nominal identity and the ultimate beneficiary’s actual access. The approved customer passes Commerce vetting; the JV’s beneficial owners never face scrutiny.
The topology follows a consistent pattern. An approved customer forms a joint venture described as a ‘technical collaboration’ or ‘research partnership.’ The JV itself is incorporated through holding companies in jurisdictions with minimal disclosure requirements-Singapore, Cayman Islands, British Virgin Islands, Luxembourg. Those holding companies have limited partners whose identities are not publicly disclosed. The beneficial ownership chain becomes opaque within two or three layers. The JV never owns chips. The approved customer retains hardware. The JV receives ‘access rights’ for ‘collaborative research.’ Compute consumption occurs under the approved customer’s nominal identity, but the developmental benefit flows to parties invisible to Commerce.
The simulation scores JV structures harshly on integrity metrics. Causal Signal Integrity falls to the 0.03-0.09 range-among the lowest possible, indicating chains engineered for non-attribution rather than incidental complexity. Institutional Update Velocity runs very high, meaning JVs reconfigure rapidly to mask control relationships when scrutiny approaches. Legacy Inertia runs extremely low, meaning governance documents filed at formation do not constrain actual behavior. Incentive Alignment between the approved customer and the illicit beneficiary runs high, meaning both parties are motivated to maintain the arrangement.
Knowledge Transfer Velocity
The JV pathway enables knowledge transfer that outpaces hardware transfer as a leakage channel. Training run data-model weights, gradients, hyperparameters-can be shared under collaboration agreements. Architectural insights about what optimization strategies work on H200 hardware flow through ‘joint research’ activities. Personnel embedded as ‘secondees’ in the JV return to non-allied entities carrying tacit knowledge that no export control can intercept. The JV functions not as a business but as a capability relay.
The simulation estimates a 71% probability that JVs formed within twelve months of H200 approval become primary conduits for unauthorized access. Early detection probability runs at only 9%. By twenty-four months, knowledge transfer through JV channels outpaces hardware diversion as the dominant leakage mechanism. By thirty-six to forty-eight months, unwinding JV structures requires regulatory intervention against entrenched, legally sophisticated entities.
Detection Challenges
The announced policy imposes no JV transparency requirements. Approved customers face no obligation to disclose joint ventures formed after approval. Technical collaboration agreements remain private documents with undefined scope. No agency traces beneficial ownership at the LP level. JV architects design structures to appear compliant in isolation-the violation only emerges when investigators map the full chain, which few agencies have the resources or mandate to do.
The intervention levers include mandatory JV disclosure for approved customers, forensic review of technical collaboration agreements, and beneficial ownership tracing through holding company layers to ultimate controllers. Implementation would require coordination across Commerce, Treasury, and potentially allied regulators in intermediary jurisdictions.
Insight: The JV doesn’t own chips. It doesn’t need to. It owns access-and access is what the export controls were supposed to restrict.
VI. Compute Arbitrage at Scale
Behavioral drift, PE ownership transformation, and JV intermediation share a common limitation: all three operate at the pace of organizational change. Drift takes twelve to twenty-four months to mature. PE acquisitions require months to close and restructure. JVs require months to establish and populate with personnel. The fourth exploit pathway-compute arbitrage-operates at a different velocity entirely. Arbitrage scales instantly, requires no corporate restructuring, and can provision access to thousands of users within days. If drift represents erosion, PE represents replacement, and JVs represent circumvention, arbitrage represents industrialization. Arbitrage threatens strategic interests most directly because enforcement cannot match its speed.
The fourth simulation models the most scalable exploit: approved customers reselling compute capacity as a service to non-approved parties. Compute arbitrage follows the Indonesia pattern-documented in Part I of the trilogy, where Chinese AI firms accessed NVIDIA compute through Indonesian data centers-but institutionalized and industrialized. Unlike physical transshipment, which requires moving hardware and leaves customs trails, compute arbitrage operates at the speed of authentication. Access can be provisioned in minutes, serve thousands of concurrent users, and leave audit trails controlled entirely by the arbitrageur.
The economic logic is compelling. H200 acquisition costs $30-40K per chip plus the 25% surcharge. Cloud-equivalent resale margins run 40-60% gross. Capacity utilization targets of 85%+ are standard in the industry. The break-even on a resale model is fourteen to eighteen months. GPUs sitting idle are losses-every finance team knows this. The approved customer who discovers it can monetize excess capacity by offering compute-as-a-service faces a straightforward business decision. Under the announced policy, nothing prevents that decision from being executed.
The simulation models three distinct arbitrage channels. Direct resale involves the approved customer offering cloud compute services to third parties with no disclosure requirement for downstream customers. Platform intermediation involves the approved customer providing capacity to a compute marketplace that aggregates demand and abstracts end-user identity behind a platform layer. Nested authentication involves the approved customer granting access to a subsidiary or contractor who creates accounts for its own clients, introducing two-hop distance from the original approval. All three channels exploit the same gap: the policy verifies the approved customer but imposes no requirements on who the approved customer serves.
Why Arbitrage Becomes Equilibrium
The simulation identifies compute scarcity as the primary driver. Chinese AI firms face severe constraints on frontier compute access-constraints the H200 policy partially relieves for approved customers but not for the broader market. Scarcity creates premium pricing for anyone who can provide access. Approved customers sit on a supply that restricted actors desperately want. The margin opportunity is substantial. The enforcement probability is low. The audit trail is self-controlled. Rational actors arbitrage.
Causal Signal Integrity for arbitrage chains runs 0.12-0.20-higher than the JV pathway because the structure is simpler, but still firmly in opacity-favorable territory. The simulation estimates a 68% probability that an arbitrage ecosystem forms within eighteen months and a 57% probability that non-approved actors gain sustained access through these channels. Regulatory catch-up probability within two years: only 26%.
Velocity Advantage
The arbitrage pathway’s most dangerous feature is its scalability. The November DOJ case involved 400 GPUs physically transshipped through Malaysia and Thailand-a significant diversion that required months to execute and left documentary traces. Compute arbitrage can provision equivalent capability to thousands of users within days, requires no physical movement, leaves no customs records, and operates within the nominal identity of an approved customer. The velocity mismatch between exploit and enforcement is severe.
Intervention requires real-time workload identity logging, a reseller licensing regime that extends vetting to downstream customers, and multi-agency enforcement synchronization. Without these mechanisms, the arbitrage ecosystem entrenches faster than regulators can respond.
Insight: The approved customer becomes a capability laundromat-Commerce-vetted at the front door, completely opaque at the back.
VII. What the Simulations Reveal Together
Each simulation models a distinct exploit pathway, but the four pathways operate in the same policy environment and share common structural features. Taken together, the simulations reveal a pattern: the ‘approved customer’ framework creates compliance credentialing without compliance monitoring. The approval process is rigorous. The follow-through is absent. The result is a system that performs security theater at the gate while leaving the perimeter unguarded.
The table below compares the four pathways on key parameters. Causal Signal Integrity indicates how traceable each chain remains-lower scores mean higher opacity. Time to Opacity indicates how quickly each pathway reaches its mature exploit state. Detection Gap identifies the control mechanism missing from the policy that would enable identification.
Probability Distribution
The qualitative patterns are clear. But strategy requires quantification-probabilities that can inform resource allocation, timeline planning, and policy prioritization. The simulations generate outcome probabilities that quantify the likelihood of each exploit reaching operational scale. Access-sharing as equilibrium behavior for approved customers: 62%. PE acquisition leading to material compliance degradation: 74%. JV structures becoming primary unauthorized access conduits: 71%. Arbitrage ecosystem formation: 68%. Probabilities above 60% for all four pathways are not edge-case scenarios-they represent the most probable behavioral outcomes given the incentive structures in play.
The corresponding detection probabilities are sobering. Enforcement detection of drift within three years: 21%. Detection of PE-driven degradation before completion: 14%. Early detection of JV exploits: 9%. Regulatory catch-up on arbitrage within two years: 26%. The gap between exploit probability and detection probability defines the strategic risk the policy creates. Capability will flow through these channels faster than enforcement can identify, investigate, and interdict.
The Revenue-Control Tradeoff
The gap between exploit probability and detection probability did not emerge by accident. The asymmetry reflects a design choice embedded in the policy’s architecture-a choice that becomes visible when examining how the 25% surcharge actually functions.
The 25% surcharge is the policy’s most visible feature and its most revealing limitation. The surcharge monetizes the transaction but does not monitor capability. Revenue collection happens at the point of sale-a single event. Capability exploitation happens continuously afterward-an ongoing process the surcharge cannot observe. The policy captures value from NVIDIA’s transaction with the approved customer but has no mechanism to capture, or even see, the value that flows from the approved customer to downstream beneficiaries.
Commercial reopening over strategic protection is the fundamental design choice the policy makes. The choice may be defensible on economic grounds-NVIDIA’s market position, American jobs, competitive dynamics with Chinese domestic alternatives. But the tradeoff should be understood for what it is. The policy solves NVIDIA’s problem. The policy does not solve America’s problem. The two problems are related, but they are not the same.
The four exploit pathways converge on a single structural truth: the policy was designed to reopen a market, not to govern what happens after that market opens. Governance would require the controls identified in Section I-and those controls remain absent. The next section specifies what implementing them would require.
Insight: The policy collects 25% of what NVIDIA sells. It has no visibility into what gets resold, shared, relayed, or extracted afterward. Revenue is not control.
VIII. Closing the Gaps
The simulations identify specific control mechanisms that would substantially reduce exploit probability across all four pathways. None of these mechanisms appear in the announced policy. All of them could be implemented through regulatory action or legislative mandate within the 2026-2027 window the trilogy identified as critical. The question is whether policymakers recognize the gaps before the exploit ecosystems entrench.
The recommendations fall into two categories: immediate interventions that could be implemented within six months of policy refinement, and structural reforms that require longer development timelines but address root causes rather than symptoms.
Immediate Interventions
Mandatory workload identity logging would require approved customers to maintain auditable records of who uses compute, from where, and for what purpose. Standardized logging formats would enable cross-provider analysis and pattern detection. Workload identity logging alone closes the visibility gap that enables all four exploit pathways-drift, PE transformation, JV relay, and arbitrage all depend on the absence of usage tracking.
Six-month recertification cycles would prevent approval from becoming a permanent credential. Recertification should include beneficial ownership refresh, end-use verification, and access-pattern review. The cadence matters: ownership structures and operational behavior can change significantly within six months, as the simulations demonstrate.
Beneficial ownership transparency requirements would mandate disclosure of all owners with greater than 5% stake, traced through holding company layers to ultimate beneficial owners. Any non-allied ownership above threshold would trigger enhanced review. Ownership transparency specifically targets the JV pathway, where opacity is engineered through corporate layering.
Structural Reforms
PE acquisition review requirements would mandate notification to Commerce of any private equity transaction involving an approved customer. Review would include CFIUS-style analysis of the new ownership structure, mandatory LP disclosure for any fund acquiring controlling interest, examination of fund governance rights and side-car arrangements, and assessment of cross-portfolio coordination risk. Any PE acquisition would trigger automatic recertification of the underlying export approval. PE acquisition review directly addresses the ownership transformation pathway the PE simulation identifies.
JV forensic review requirements would flag any joint venture formed by an approved customer within twelve months of approval for automatic Commerce examination. Technical collaboration agreements would require scope disclosure. Forensic review prevents the ‘clean at formation, opaque in operation’ pattern the JV simulation identifies.
A compute resale licensing regime would require approved customers offering compute-as-a-service to third parties to obtain separate authorization. End-user verification would extend to resale customers. Resale licensing directly addresses the arbitrage pathway by making downstream access visible rather than hidden.
Geo-fenced execution zones would require approved customers to implement region-locked training environments. Workloads could not migrate across jurisdictional boundaries without explicit authorization. Geo-fencing prevents the geographic arbitrage variant where compute physically located in approved jurisdictions serves users in restricted territories.
Multi-agency enforcement synchronization would establish shared intelligence on ownership patterns, access anomalies, and transshipment indicators across Commerce, DOJ, Treasury, and allied regulators. Unilateral enforcement cannot address multi-vector exploits-coordination is structural necessity, not bureaucratic preference.
Insight: The controls exist. The frameworks are understood. The question is whether implementation happens before or after the exploit ecosystems mature.
IX. The Window
The preceding sections have catalogued gaps and prescribed fixes. But honest analysis requires acknowledging why those fixes were not included in the first place. The policy’s architects were not ignorant of leakage risks. They made a choice-and that choice deserves to be understood on its own terms before being critiqued.
The H200 export approval addresses a real commercial problem. NVIDIA lost substantial revenue when Biden-era restrictions confined it to downgraded chips that China ultimately rejected. American jobs and manufacturing investment depend on NVIDIA’s competitive position. Reopening the China market, even partially, serves legitimate economic interests. The policy is not wrong to pursue those interests.
But commercial reopening and strategic protection are different objectives that require different mechanisms. The policy achieves the first objective. The policy does not attempt the second. The ‘approved customer’ framework creates a credentialing system without a monitoring system. The framework gates access at the point of sale without tracking capability after delivery. The framework collects revenue without maintaining visibility. The result is a policy that will successfully reopen NVIDIA’s market access while simultaneously enabling capability flows the original export controls were designed to prevent.
The simulations quantify the tradeoff’s consequences. Behavioral drift, PE ownership transformation, opaque JV intermediation, and compute arbitrage are not speculative risks-they are the predictable behavioral responses to the incentive structures the policy creates. The probability that at least one major exploit pathway reaches operational scale within eighteen months exceeds 70%. The probability that enforcement detects and interdicts before entrenchment is below 25%. The gap between those numbers defines the strategic risk the policy accepts.
The 2026-2027 window identified in the trilogy remains the critical period. If the recommended controls are implemented within that timeframe-workload identity logging, recertification cycles, PE acquisition review, beneficial ownership transparency, JV disclosure, resale licensing, multi-agency coordination-the exploit pathways can be substantially closed before they institutionalize. If they are not, the parallel capability ecosystem that forms will operate outside formal export architecture. The leakage the original controls sought to prevent will occur through policy-created channels rather than despite them.
The question is no longer whether the H200 will reach non-allied actors. It is whether the policy framework will evolve quickly enough to maintain visibility and control over how it reaches them.
Insight: The policy opens the door. Whether it watches who walks through-and where they go afterward-remains undecided.