

MCAI National Innovation Vision: China's H200 Import Block and the Reordering of National Innovation Control
The Two-Gate Game

Executive Summary
China’s refusal to accept NVIDIA H200 shipments transforms U.S. export approval into a non-event. A two-gate architecture has emerged in which import acceptance—not export eligibility—now determines technological sovereignty. Beijing is forcing domestic firms to internalize national constraints, accelerate adaptation around indigenous accelerators, and abandon expectations of frictionless access to foreign compute.
The strategic logic is behavioral, not acquisitive. One system optimizes for control of behavior; the other optimizes for control of transactions. Neither governs post-delivery capability flow. A gate without a fence invites another gate.
Beijing moved after the U.S. announced its policy on January 13-14—a reaction to terms, not a preemptive negotiating setup. The timing shifts probability mass toward structural rejection (Scenario C) and away from pure leverage extraction. Scenario A nonetheless remains the base case at 0.45 because it includes not only active concession extraction (A1) but also signaling optionality (A2)—demonstrating leverage without necessarily closing a deal.
MindCast AI’s Cognitive Digital Twin (CDT) simulation maps the H200 scenario into scenario probabilities and falsifiable predictions. The Two-Gate Control Index (TGCI) at 0.28 serves as a live system health indicator, updated monthly. Values below 0.40 confirm dual-gate dominance over unilateral control. The April 2026 Trump-Xi summit functions as a forcing function only if domestic accelerator velocity is tracking; otherwise the block converts from negotiating lever to time-buy.
Core Prediction: China will continue to block commercial H200 access, tolerate limited gray-market leakage, force domestic substitution through ecosystem discipline, and test—but not necessarily concede to—U.S. monetized access architecture. The United States will respond with process friction and targeted enforcement rather than tariff escalation or supply-chain decoupling. The dual system stabilizes as a contested equilibrium through 2026.
Publication Context: MindCast AI National Innovation Vision Series
The Two-Gate Game is the eighth publication in MindCast AI’s National Innovation Vision series examining U.S.-China technology competition and export control dynamics. Prior publications established the analytical foundations this analysis extends:
H200 China Policy Validation — Documented 17-of-17 structural prediction confirmations when the January 14, 2026 policy announcement validated the series’ architectural foresight.
The TSMC China License and the Limits of Hardware Export Controls — Quantified the ‘gate without fence’ architecture and identified Q2 2027 as the Inevitability Threshold.
China Data Center Consolidation and H200 Exploit Pathway Evolution — Predicted state-coordinated consolidation under technically competent operators would raise exploit probabilities while lowering detection rates.
NVIDIA H200 China Policy Exploit Vectors — Modeled four high-probability exploit pathways (drift, PE transformation, JV intermediation, arbitrage) under the ‘approved customer’ framework.
The Department of Justice, China, and the Future of Chip Enforcement — Mapped enforcement timing gaps showing DOJ cycles run 18–36 months while adversaries adapt in 3–6 months.
The Global Innovation Trap — Established why hardware-centric export controls fail when capability leakage compresses innovation advantage windows from 8–10 years to 2–4 years.
Aerospace’s Warning to AI — Demonstrated how third-country routing and opaque joint ventures become systematic capability-laundering channels before enforcement can respond.
The Two-Gate Game extends the series by modeling China’s import-side response—the second gate that transforms U.S. export approval into a non-event.
Contact mcai@mindcast-ai.com to partner with us on National Innovation Economics foresight simulations. See recent publications: The Stigler Equilibrium- Regulatory Capture and the Structure of Free Markets (Jan 2026), Federal Inaction Has Elevated State Authority on Consumer Protection, Antitrust, and Market Integrity, Briefing for State Attorneys General (Jan 2026), Venezuela’s Transition and China’s Advantage in the AI Supply Chain (Jan 2026).
PART I: STRATEGIC ANALYSIS
Part I establishes the strategic context for China’s H200 import block. The analysis begins with the policy sequence that triggered the block, advances a thesis explaining Beijing’s behavioral logic, and develops a comparative framework distinguishing Chinese and American approaches to innovation control. The section concludes by examining how China expects its domestic industry to adapt under constrained access.
Background and Context
In mid-January 2026, U.S. export controls governing advanced AI accelerators shifted materially. The Bureau of Industry and Security moved NVIDIA’s H200 from a presumption of denial to a case-by-case licensing framework, permitting sales subject to third-party testing, security attestations, quantity caps tied to U.S. domestic supply, and a 25 percent tariff surcharge.
Within forty-eight hours, Chinese customs authorities instructed logistics agents in Shenzhen that H200 chips were “not permitted” to enter China. Domestic technology firms received summons to meetings where officials told them not to place orders unless “absolutely necessary.” No statute changed. No regulation was promulgated. The border simply closed.
Market reaction was immediate. Suppliers of specialized printed circuit boards and other H200 components halted production, fearing write-offs on millions of units in the order pipeline. The supply chain response revealed a structural fact: import acceptance risk, not export eligibility, now determines transaction viability. U.S. firms now face China exposure as a probabilistic revenue stream rather than a market.
The policy sequence matters. Washington opened a gate; Beijing declined to walk through. Understanding why requires examining the behavioral economics of national innovation control.
Thesis: Ecosystem Discipline Over Technical Acquisition
China’s H200 import block reflects a mature phase of national innovation policy. Beijing is no longer optimizing primarily for reverse-engineering insights. Instead, ecosystem discipline outweighs marginal technical acquisition—forcing firms to internalize national constraints, redirect workloads, and invest in domestic stacks even at significant short-term efficiency cost.
Bootlegging and gray-market acquisition do not contradict the policy. Limited leakage functions as a tolerated pressure-release valve, preserving frontier exposure without reshaping the ecosystem—unless volumes cross scale thresholds that trigger ecosystem-shaping effects.
The thesis predicts specific firm behaviors: hyperscalers will redirect workloads to domestic accelerators despite efficiency losses; research institutions will receive narrow “special circumstances” access; gray-market channels will persist but remain volume-constrained. Part III tests these predictions against falsifiable conditions.
A clarifying distinction sharpens the analysis. The H200 is the trigger—the specific product that activated the block. U.S. monetized access is the target—the control architecture Beijing finds unacceptable. Import denial is the instrument—the mechanism by which China asserts sovereignty over inbound technology flows. Beijing may accept specific chips while rejecting the broader architecture, or reject both. The scenarios in Part III capture this ambiguity.
Comparative Framework: Two Philosophies of Innovation Control
China and the United States optimize for different failure modes. China optimizes against long-run dependence; the United States optimizes against near-term security risk and political backlash. The contrast illuminates why both systems deployed controls yet achieved opposite effects.
Controlling Insight: The United States built a monetized export gate and assumed delivery would follow. China declined to walk through, asserting its own control at the import boundary. One system optimizes for control of behavior; the other optimizes for control of transactions.
China: Ecosystem Discipline First
Beijing’s primary control surface is import acceptance and administrative discretion. Officials deploy reversible throttles—customs holds and informal guidance—rather than formal statutes. The state tolerates high short-term inefficiency if inefficiency accelerates domestic stack maturation. Leakage remains acceptable at low scale but becomes dangerous only when it reaches ecosystem-shaping volumes. The objective function: force adaptation and compress the autonomy timeline.
United States: Risk Management and Monetized Access
Washington’s primary control surface is export eligibility and licensing. Officials deploy formal rules, tariffs, and case-by-case approvals. The system exhibits low tolerance for inefficiency, especially when restrictions harm domestic firms. Enforcement treats leakage as a prosecutable violation requiring deterrence. The objective function: reduce adversary risk while preserving commercial stability.
The asymmetry explains the H200 outcome. American controls assumed that eligibility confers access; Chinese controls demonstrated that acceptance determines flow. Neither system governs what happens after delivery—a gap both exploit through different means.
From Acquisition to Discipline: Why China Blocked What It Could Buy
China treats frontier compute as strategic infrastructure, not as an ordinary tradable good. By choosing customs discretion over a formal ban, Beijing preserved escalation control and reversibility. Administrative holds can be tightened, loosened, or selectively bypassed without signaling weakness or triggering formal trade disputes.
Chinese engineers already possess extensive technical knowledge derived from prior-generation NVIDIA hardware. The H200’s marginal advances—primarily higher-bandwidth HBM3e memory integration—present manufacturing, yield, and ecosystem integration problems rather than discovery problems. Allowing large-scale commercial imports would delay domestic learning by anchoring engineers, software teams, and operators to CUDA-first optimization paths.
At the current phase, controlled scarcity accelerates adaptation more effectively than access. Beijing prioritizes ecosystem hardening over marginal insight—a calculation that only makes strategic sense if the performance gap is compressible on a known timeline.
Expected Industry Response Under Constrained Access
Beijing’s policy creates differentiated pressure across three industry segments. Each segment faces distinct incentives that the CDT simulation models to generate behavioral predictions.
Hyperscalers and Platform Firms
Major platforms face pressure to halt large-scale H200 deployment and redirect workloads to domestic accelerators. The state anticipates reduced efficiency, higher operating costs, and slower training throughput. Beijing accepts those costs if they accelerate long-run independence.
Universities and State Research Institutions
Narrow “special circumstances” access preserves frontier experimentation and talent development without enabling commercial scale. A verification vulnerability exists: the mechanism by which the state verifies university-only shipments remains opaque. If end-use certification proves easily spoofed through shell procurement entities or researcher misrepresentation, actual enforcement discretion may fall below model estimates.
Gray-Market and Parallel Channels
Smuggling and indirect acquisition will persist as official channels remain closed. China tolerates limited leakage because small volumes do not scale, do not anchor ecosystems, and do not undermine domestic vendor demand. Tolerance ends when volumes approach ecosystem-shaping thresholds.
Gray-market acquisition has expanded predictably—the shadow of a throttled system where per-unit value is enormous and demand is inelastic. Both states implicitly accept that perfect enforcement is neither feasible nor necessary. The result is a dual system: macro-level throttling with micro-level leakage. The equilibrium is stable because it serves both states’ objective functions: Beijing gets ecosystem discipline at scale while preserving regime flexibility; Washington gets a visible enforcement posture while admitting that prosecution and secondary sanctions cannot stop boutique arbitrage. Neither state has incentive to move toward perfect enforcement or perfect openness.
Critical Assumption: The CDT simulation assumes gray-market leakage remains below ecosystem-shaping scale. If arbitrage incentives compound and coordinated procurement emerges via Singapore/Malaysia hubs or state-backed intermediaries, the assumption breaks and Scenario C probability increases. Part III specifies the threshold indicators.
Part I has established the strategic logic underlying China’s import block. Beijing is guaranteeing demand for domestic accelerators by starving the superior alternative—not imitation strategy but forced substitution as industrial policy. Part II translates this qualitative analysis into quantified CDT metrics.
PART II: COGNITIVE DIGITAL TWIN OPERATIONALIZATION
Part II translates the strategic analysis into quantified metrics using MindCast AI’s CDT simulation methodology. The section identifies the primary actors modeled, specifies the Vision Functions activated, and reports the key metric readings that ground Part III’s foresight predictions. All scores represent CDT-calibrated estimates on a 0–1 scale designed for falsification, not claims of measured ground truth.
Methodology and Actor Mapping
The CDT simulation integrates six Vision Functions into a cascading analytical sequence: Causal Signal Integrity (CSI)confirms the signal is intentional → National Innovation Behavioral Economics (NIBE) Vision evaluates innovation sequencing → Regulatory and Disclosure Vision classify instrument choice → Institutional Cognitive Grammar (ICG)Vision confirms institutional patterns → Field-Geometry Reasoning (FGR) Vision identifies constraint geometry → Strategic Behavioral Cognitive (SBC) Vision forecasts firm-level adaptation.
The simulation models two state actors and five corporate/institutional actor classes. State actors: The China CDT (Customs/MIIT/MOFCOM) controls import acceptance, industrial sequencing, and domestic discipline. The United States CDT (BIS/Commerce/DOJ/Treasury) controls export eligibility, enforcement posture, financial coercion, and alliance signaling. Corporate and institutional actors: NVIDIA CDT (inventory exposure, revenue volatility, lobbying incentives); Chinese Hyperscalers CDT covering Alibaba, Tencent, and ByteDance (compute demand, compliance tradeoffs, workload migration); Universities and State Labs CDT; Upstream Suppliers CDT covering PCB, HBM, and integrators; and Gray-Market Networks CDT (arbitrage incentives, routing elasticity).
The methodology produces scores across multiple Vision Functions. Four metrics drive the foresight predictions in Part III.
Key Metrics and Current Readings
Two-Gate Control Index: 0.28 ± 0.12
The TGCI serves as the core system health indicator, calculated as P(export license) × P(import clearance | license). At 0.28, the index confirms dual-gate dominance—values below 0.40 indicate that neither unilateral gate controls transaction flow. Import acceptance functions as the binding constraint. Recovery threshold: TGCI above 0.45 signals system normalization toward single-gate dominance; TGCI above 0.60 indicates effective unilateral U.S. control restored.
Enforcement Discretion Index: 0.88 ± 0.07
The Enforcement Discretion Index (EDI) measures control achieved through administrative action rather than statute. At 0.88, the score supports the reversibility thesis: Beijing can modulate without formal policy change, preserving escalation control and optionality. Confidence discount: The EDI carries a spoofability adjustment. If end-use certification for “special circumstances” proves easily circumvented through shell procurement entities, the effective EDI drops by 0.10–0.15, indicating that stated discretion exceeds actual control.
Behavioral Drift Factor: 0.72 ± 0.12
The Behavioral Drift Factor (BDF) measures forced adaptation pressure on firms toward domestic accelerators. At 0.72, hyperscalers face high drift pressure, retooling operations even at significant efficiency cost. The score quantifies the ecosystem discipline thesis from Part I.
Geodesic Availability Ratio: 0.31 ± 0.14
The Geodesic Availability Ratio (GAR) measures the scalability of alternative routing paths. At 0.31, gray routes exist but do not scale reliably. The score supports the assumption that leakage remains below ecosystem-shaping thresholds—for now.
Domestic Maturity Offset: 0.58 ± 0.15
The Domestic Maturity Offset (DMO) quantifies the performance gap Beijing seeks to time-box through the import block. The score incorporates two observables: Huawei Ascend 910C shipment velocity (target: 500K+ units by Q2 2026) and SMIC 7nm yield rates (target: 40%+ for competitive economics). At 0.58, domestic alternatives remain materially inferior but are tracking toward substitution viability. DMO above 0.70 weakens Scenario B (Capability Delay) incentives; DMO below 0.45 strengthens Scenario C (time-buy logic).
Two-Gate Control Index Scenario Trajectories
The TGCI serves as a live indicator with expected trajectories varying by scenario. Under Scenario A (Negotiating Tactic), the TGCI rises from 0.28 toward 0.45–0.55 as named clearances appear and guidance shifts. Under Scenario B (Capability Delay), the TGCI holds at 0.30–0.35 as research corridors open while commercial channels stay blocked. Under Scenario C (Structural Shift), the TGCI falls to 0.10–0.15 as the block hardens and expands to adjacent categories.
Monthly TGCI updates will track against these trajectories. Observable drivers include Shenzhen customs reporting, supplier production signals, named clearances, and gray-market price movements (inverse proxy). Correlation between TGCI movement and observables above 0.7 validates the index as a reliable system health indicator.
Part II has operationalized the strategic analysis into quantified CDT metrics. The TGCI at 0.28 confirms dual-gate dominance; the EDI at 0.88 (with spoofability discount) confirms administrative discretion; the BDF at 0.72 confirms firm adaptation pressure; the GAR at 0.31 confirms gray-market limits; the DMO at 0.58 quantifies the domestic capability gap Beijing seeks to close. Part III applies these metrics to generate scenario probabilities and falsifiable predictions.
PART III: FORESIGHT PREDICTIONS
Part III translates the CDT metrics into actionable foresight. The section specifies scenario probabilities with revision rationale, identifies the April 2026 summit as a conditional forcing function, maps likely U.S. institutional responses, establishes gray-market threshold indicators, and defines falsification conditions for each scenario. The analysis concludes with five quantified forecasts for 2026.
Scenario Probabilities
Revision rationale: Beijing moved after the U.S. announced policy—a reaction to terms, not preemptive leverage. The timing shifts probability mass toward structural rejection (Scenario C) and away from pure extraction (Scenario A). Scenario A splits into two sub-variants to capture the distinction between active concession extraction and signaling optionality.
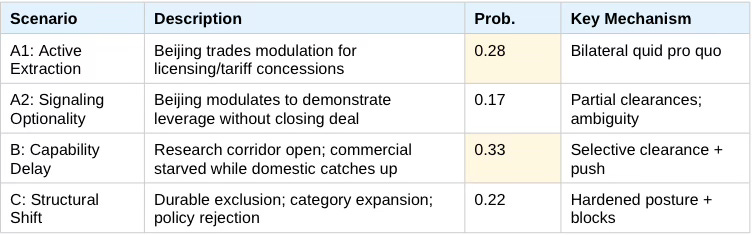
Scenario A (combined) remains the base case at 0.45, but Scenario C has upgraded to 0.22—reflecting the structural rejection interpretation suggested by Beijing’s reactive timing.
April 2026 Summit as Conditional Forcing Function
The Trump-Xi summit scheduled for April 2026 in Beijing provides a game-theoretic resolution window. Whether modulation occurs depends on an intervening variable: domestic accelerator velocity. April only resolves Scenario A if domestic velocity is tracking. If Huawei and SMIC are lagging, Beijing’s incentive inverts—the block becomes a time-buy rather than a negotiating lever.
Key observables: Huawei 910C shipments below 500,000 units by Q2 strengthen Scenario B. SMIC 7nm yield rates below 40% strengthen Scenario C as a time-buy. Lagging hyperscaler deployment announcements reduce modulation likelihood across all A-variant scenarios.
If Beijing pursues active extraction under Scenario A1, the likely asks span four domains. On licensing scope, Beijing seeks a pathway for Blackwell-class access; success appears if U.S. guidance softens. On tariff structure, Beijing seeks reduction or carve-outs on the 25% surcharge; success appears if public review lowers the rate. On compliance burden, Beijing seeks lower friction and faster approvals; success appears if review times shorten. On supply-chain assurance, Beijing seeks a formal corridor for Chinese buyers; success appears if “special circumstances” formalizes.
Falsification: If none of these domains move while the customs block remains, the negotiating-tactic scenario (A1/A2) weakens materially and probability shifts to B or C.
Likely United States Institutional Response
Washington will respond asymmetrically across agencies with different time horizons. Understanding institutional lag is essential for supply-chain planners: Treasury can move in weeks (SDN list additions); BIS friction takes months (licensing delays); DOJ indictments are trailing indicators with 18–36 month latency. A lack of immediate legal action does not signal U.S. acceptance of the block—it reflects prosecutorial timelines, not policy intent.
The two-gate architecture creates a reverse trap for Western suppliers. When China’s import gate closes, delay propagates upstream through the Delay Propagation Index (DPI): customs holds in Shenzhen trigger inventory write-down risk in Taiwan, which triggers production halts in component suppliers across Asia and the U.S. The gate without a fence does not merely block chips—it propagates uncertainty backward through every node in the supply chain, converting Chinese import risk into Western balance-sheet exposure.
BIS and Commerce will stretch case-by-case reviews from 60-90 days to 6-9 months. “Sufficient U.S. supply” certification will tighten, effectively shrinking allowable China volumes. Observable indicators: published processing times and industry complaints. Timeline: 2-4 months.
The Department of Justice will expand prosecutions to logistics intermediaries, using conspiracy and false-statement theories under 18 U.S.C. 371 and 1001. Observable indicators: indictments naming freight forwarders and customs brokers. Timeline: 18-36 months (trailing indicator).
Treasury and OFAC will designate intermediary logistics firms or shell entities on the SDN list. Officials may threaten or impose secondary sanctions on hyperscalers with U.S. nexus. Observable indicators: SDN list additions targeting chip routing networks; public warnings about securities access restrictions. Timeline: 2-8 weeks (fastest lever).
SEC and CFIUS will scrutinize Chinese hyperscaler ADRs and U.S. capital market access. Observable indicators: delisting threats and enhanced disclosure requirements. Timeline: 3-9 months.
The July 1 tariff review provides a credible threat point for tariff escalation or scope expansion. Observable indicators: public statements and rule modifications. Timeline: Fixed calendar date.
The response pattern reflects institutional capacity rather than strategic coherence. Coordination failures between agencies may create arbitrage opportunities for intermediaries in the 2-18 month window before enforcement synchronizes.
Gray-Market Threshold Indicators
The CDT simulation assumes gray-market leakage remains below ecosystem-shaping scale. Four threshold indicators trigger a Scenario C probability upgrade of +0.08 to +0.12 if any two cross:
Cumulative volume: Gray-market H200 units in China exceed 50,000 by Q2 2026, indicating leakage approaching ecosystem-shaping scale.
Price compression: Gray-market premium falls below 1.5× list price, signaling volume-driven price compression and scale emergence. Current tracking: Premium at approximately 2.3× as of January 2026; convergence toward 1.5× indicates supply normalization through unofficial channels.
Coordinated deployment: Documented multi-rack deployments from gray-sourced chips exceed three clusters, indicating coordinated procurement rather than opportunistic arbitrage.
Routing hub emergence: Singapore or Malaysia volume spikes materially, indicating state-adjacent intermediary networks have activated.
Crossing any two thresholds signals that the dual-system assumption has broken. Gray-market channels would no longer function as pressure-release valves but as ecosystem-shaping alternative supply routes. The thresholds are treated as independent; crossing any two signals structural shift regardless of which pair. The independence assumption is testable: if thresholds move together at high correlation (> 0.8), the underlying mechanism may be unified state coordination rather than independent market constraints, requiring model revision toward Scenario C.
Falsification Conditions and Signal Modulation
Each scenario specifies conditions under which it would be confirmed or falsified. Falsification discipline determines the model’s credibility. Beyond confirmation conditions, the model defines invalidation signals—events that force immediate probability downgrades regardless of other indicators.
Invalidation Signals (Immediate Probability Adjustments)
Scenario C invalidation: If a major Chinese hyperscaler (Alibaba, Tencent, or ByteDance) announces a new cluster utilizing officially imported H200s before the April summit, Scenario C (Structural Shift) drops by ≥ 0.10 immediately.
Scenario A invalidation: If China expands the block to cover Blackwell-class or adjacent accelerator categories before April, Scenario A (both variants) drops by ≥ 0.12 and Scenario C upgrades correspondingly.
Scenario B invalidation: If SMIC 7nm yields exceed 50% or Huawei 910C shipments exceed 750K by Q2, Scenario B (Capability Delay) drops by ≥ 0.08 as the time-buy rationale weakens.
Scenarios A1 and A2: Negotiating Tactic
Modulation confirms A-variants if any two of the following occur by late April 2026: (1) Named clearance for a major platform buyer or state-backed consortium; (2) Shenzhen customs language changes from “not permitted” to “subject to additional verification”; (3) Written criteria for “special circumstances” circulate or receive institutional acknowledgment; (4) Public statements reframe the block as temporary or conditional.
Distinguishing A1 from A2: If modulation occurs with observable U.S. concessions (licensing or tariff movement), code as A1 (Active Extraction). If modulation occurs without U.S. concessions, code as A2 (Signaling Optionality).
Falsification: None of the above occur and the hold remains categorical through late April 2026.
Scenario B: Capability-Buying Delay
Confirmation requires that research corridors operate consistently while hyperscaler commercial imports remain blocked through mid-2026, AND domestic accelerator velocity metrics show lagging performance (Huawei shipments below 500K; SMIC yields below 40%).
Falsification: Routine high-volume commercial imports resume without domestic-first procurement pressure.
Scenario C: Structural Shift
Confirmation requires that the block persists past April and expands to adjacent accelerator categories, OR that gray-market threshold indicators cross (any two of four).
Falsification: Sustained reopening occurs for hyperscalers or large-scale commercial imports.
Quantified Forecast Summary
Five core predictions for 2026 derive from the CDT simulation:
High optionality maintained: China maintains administrative holds without formal bans through Q2, keeping EDI ≥ 0.80. Observable: no statutory changes; continued customs discretion.
Permanent supplier discounting: Policy uncertainty propagates upstream; TGCI remains ≤ 0.40 through mid-2026. Observable: suppressed production runs; prepayment requirements.
Friction and enforcement response: U.S. responds with process friction rather than tariff escalation. Observable: licensing delays exceed six months; DOJ and OFAC cases targeting intermediaries increase.
Gray-market below threshold: Leakage remains below ecosystem-shaping scale through Q2. Observable: cumulative units below 50K; premiums stay above 1.5×; no mass deployment.
Index reliability validated: Monthly TGCI tracks within ±0.08 of scenario trajectory. Observable: correlation with customs reporting, supplier signals, and price movements exceeds 0.7.
Part III has translated CDT metrics into falsifiable predictions. Scenario A (combined) at 0.45 remains the base case; Scenario C at 0.22 reflects structural rejection risk. April 2026 serves as a conditional forcing function contingent on domestic accelerator velocity. Gray-market thresholds and falsification conditions provide ongoing validation tests.
IV. Conclusion
China’s H200 import block represents intentional innovation throttling, not technological retreat. Beijing forces domestic firms to internalize national constraints, accelerate adaptation around indigenous accelerators, and abandon expectations of frictionless access to foreign compute.
The CDT simulation confirms the qualitative conclusion quantitatively. Import acceptance functions as the dominant constraint surface. China’s customs posture scores high on discretionary control (EDI: 0.88) while generating high delay propagation into upstream production. Firm behavior shows high forced drift toward domestic accelerators (BDF: 0.72) despite significant efficiency costs.
The revised probability model reflects Beijing’s reactive timing—moving after the U.S. announcement rather than preemptively. Scenario A (combined) remains the base case at 0.45, but Scenario C has upgraded to 0.22, reflecting the structural rejection interpretation. April 2026 functions as a conditional forcing function—resolving Scenario A only if domestic accelerator velocity is tracking.
Net Assessment: The system has become two gates, no fence—quantified in the TGCI at 0.28, where values below 0.40 indicate dual-gate dominance over unilateral control. The state that can most reliably discipline behavior will control the innovation trajectory, even without controlling the hardware supply.
The MindCast AI model’s credibility depends on falsification discipline. Monthly TGCI updates, gray-market threshold monitoring, and scenario confirmation tests will validate or revise these predictions through 2026.