

🏈 MindCast AI NFL Vision: Seahawks vs. Rams — Week 16 (2025)
NFL AI Foresight Simulation | Team Cognitive Digital Twins + Behavioral Economics + Game Theory

MindCast AI builds Cognitive Digital Twins (CDTs) of teams, players, and coaches to simulate how communication, trust, and adaptation hold under stress. Simulations convert human and systemic behavior into dynamic probability bands, continuously updating as structure, clarity, and fatigue evolve in real time.
Where traditional analytics measure what happened, the MCAI foresight system measures when structure breaks—quantifying lag in protection language, timing drift between receivers and quarterbacks, and coherence decay during long drives. The output isn’t a static prediction; it’s a living probability field that moves with communication efficiency and resilience under pressure.
I. System State Entering the Rematch
Seattle arrives with an identity that sharpened over the second half of the season. This team no longer needs offensive fireworks to survive. The defense has become the stabilizing force—capable of compressing games, absorbing early mistakes, and keeping Seattle within a possession even when the offense drifts. The Indianapolis win reinforced that reality. Seattle played poorly on offense, yet the game never escaped control because the defense consistently narrowed Indianapolis’ options and forced late discomfort.
Los Angeles arrives in opposite posture. The Rams are playing with momentum, fueled by an offense that has recently scored in waves. Their comfort zone is rhythm and conversion, not patience. When allowed to play fast and turn efficiency into touchdowns, they overwhelm opponents before the fourth quarter arrives.
The rematch is not about which team is better in the abstract. The decisive question is which identity imposes itself first: Seattle’s preference for controlled, high-leverage football or Los Angeles’ preference for tempo and early separation.
II. What the First Meeting Established
The first Seahawks–Rams game revealed a leverage gap, not a talent gap. Seattle’s defense played well enough to win. The offense handed possessions back through interceptions. Those extra possessions shortened the field for Los Angeles and turned what should have been a low-scoring grind into a narrow Rams victory.
Causation Vision analysis confirms this reading. The Week 11 turnover margin registers a Causal Signal Integrity of 0.58—below the reliability gate. Translation: the turnover gap was event-driven, not structural. It should not anchor expectations for the rematch.
That game matters not because it predicts the rematch, but because it clarifies Seattle’s failure mode. Seattle did not lose because it could not move the ball. Seattle lost because it manufactured its own urgency. Once urgency appeared, the Rams played from advantage rather than survival.
The rematch does not require reinvention. It requires removing the single pathway that allowed the Rams to dictate terms.
Contact mcai@mindcast-ai.com to partner with us on sports foresight simulations. See MCAI Football Vision: Betting AI vs. Foresight AI: MindCast AI Comparative Analysis With NFL Models (Sep 2025).
III. Matchup Architecture
Seattle’s structure rewards adaptability. Offensively, the Seahawks are most effective when they use play action, intermediate routes, and early-down balance. Defensively, Seattle prefers to build pressure over time rather than force immediate chaos. This structure rewards patience and punishes opponents who assume explosive plays will eventually arrive.
The Rams’ structure is more aggressive by design. Their offense is organized around timing, spacing, and decisive quarterback play. When the passing game is clean, Los Angeles converts small defensive mistakes into sudden points. Defensively, the Rams are most comfortable playing with a lead—hunting errors rather than absorbing long drives.
That architectural contrast defines the rematch tension. Seattle wants the game to tighten as it progresses. Los Angeles wants it to open before that tightening can occur.
Composite Release Scores
The CDT framework quantifies system coherence under stress:
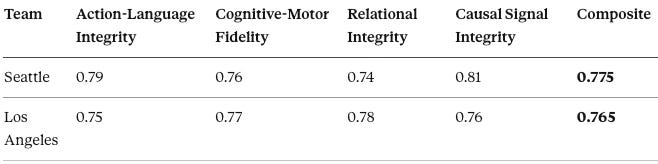
Both teams clear the release threshold. The near-identical composites (0.775 vs 0.765) explain why the game profiles as narrow—this is a leverage contest, not a talent mismatch.
IV. Wolverine Vision: Tactical Leverage Points
Wolverine Vision isolates the tactical sequences where games pivot—the specific plays, thresholds, and failure modes that determine outcomes independent of aggregate talent. Each matchup unit carries quantified leverage points that coaching staffs either exploit or surrender. The metrics below identify where pressure accumulates and where systems break.
Seahawks Offense vs. Rams Defense
Leverage plays: Play-action intermediate crossers; motion to force coverage declaration.
Primary failure mode: Hesitation against disguised zone → tipped balls.
Seahawks Defense vs. Rams Offense
Key threshold: Stafford shows cognitive degradation after 10–12 pressured dropbacks.
Rams Offense vs. Seahawks Defense
Key leverage: Early explosives to Nacua/Kupp to avoid extended drives.
Rams Defense vs. Seahawks Offense
Wolverine Verdict: Rams are best when Seattle compresses itself offensively. Seattle control is achievable if leverage is accumulated, not chased.
V. Strategic Behavioral Coordination Profiles
Coaching staffs and quarterbacks operate under incentive structures that shape in-game decisions. Strategic Behavioral Coordination Vision maps how those incentives translate into risk posture, adaptation speed, and failure modes under pressure. The profiles below reveal where each team’s decision-making architecture creates opportunity or vulnerability.
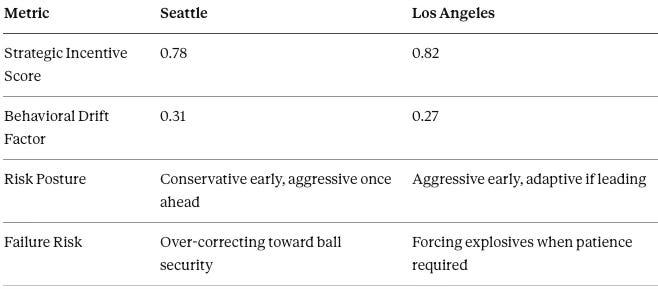
Coaching Staff Incentives
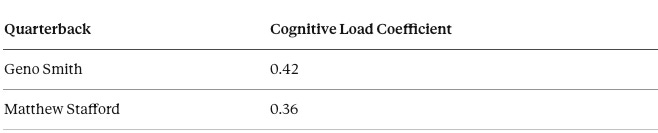
Quarterback Cognitive Load
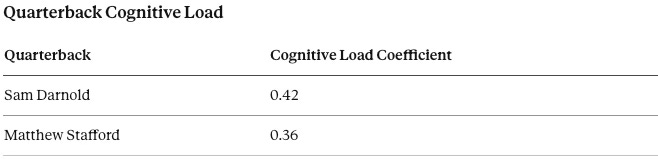
Stafford processes faster under normal conditions. But his lower coefficient assumes clean timing—exactly what home field disrupts.
Strategic Behavioral Coordination Verdict: Slight Rams edge in early decisiveness; Seattle steadier late.
VI. Institutional Plasticity and Recovery
Games rarely unfold according to script. Institutional Cognitive Plasticity Vision measures how quickly organizations adapt when initial plans fail—the speed of halftime adjustments, the efficiency of discarding broken concepts, and the capacity to process new information under stress. Seattle’s structural advantage emerges most clearly in these metrics.
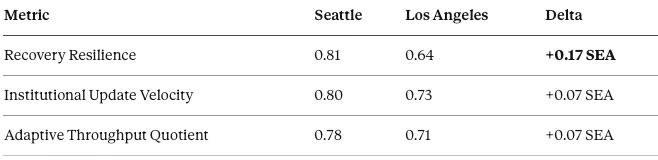
Seattle’s Recovery Resilience advantage (+0.17) is the largest single-metric gap in the entire CDT comparison. In a one-score game where both teams will face adversity, the team that resets faster after mistakes holds a compounding edge.
The Rams are slightly sharper when clean (Cognitive-Motor Fidelity: 0.77 vs 0.76). But “when clean” is the operative constraint—and home field attacks that assumption directly.
ICP Verdict: Seattle adapts faster within game; Rams slightly faster pre-script.
VII. Home Field as Probability Mechanism
The Rams’ 52–54% neutral-field edge rests on a specific offensive sequence: early explosive conversions that establish rhythm before Seattle’s defense can layer pressure. Home field doesn’t add atmosphere—it degrades the precise metrics that sequence depends on.
The Degradation Chain
Step 1: Noise disrupts timing.
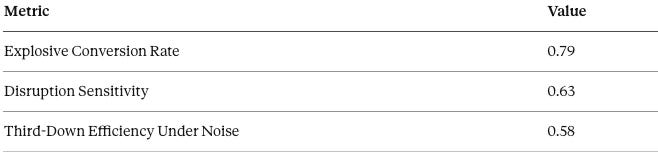
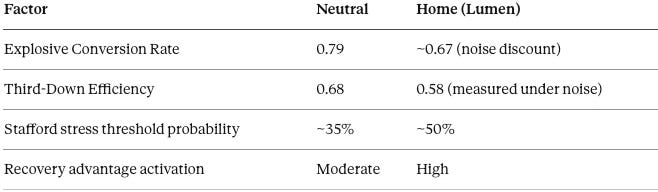
The Rams’ Explosive Conversion Rate (0.79) assumes clean protection and precise route timing. Lumen Field’s crowd noise forces silent counts, introducing pre-snap variability. The data already captures this: Rams Third-Down Efficiency Under Noise drops to 0.58—a 21-point degradation from general offensive rhythm. That’s structural vulnerability, not minor fluctuation.
Step 2: Timing disruption accelerates pressure accumulation.
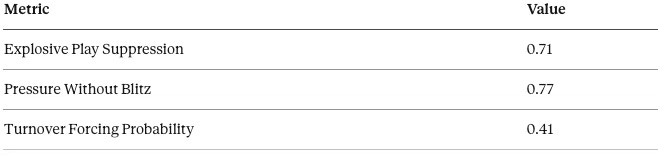
Seattle’s Pressure Without Blitz rate (0.77) survives noise better than blitz schemes—four-man pressure doesn’t require complex coverage rotation. When the Rams’ timing slips, Seattle’s pass rush reaches Stafford without sacrificing coverage integrity.
Stafford’s stress threshold (10–12 pressured dropbacks) arrives faster in hostile environments where timing is already compromised.
Step 3: Degraded timing forces longer drives.
When explosives don’t hit, the Rams must sustain drives through the middle of the field. Their Disruption Sensitivity (0.63) indicates moderate vulnerability to accumulated pressure—enough to stall drives that would otherwise convert.
Longer drives mean more third downs. More third downs under noise means more exposure to that 0.58 efficiency rate. The math compounds.
Step 4: Recovery asymmetry decides close games.
Seattle’s +0.17 Recovery Resilience advantage amplifies when both teams face 2–3 adverse events, which a one-score game guarantees.
Quantified Probability Shift
Causation Vision validated that home field materially shifts leverage at 0.73 CSI—strong enough to clear the reliability gate.
Working through the degradation chain:
Seattle’s Recovery Resilience advantage (+0.17) is the largest single-metric gap in the entire CDT comparison. In a one-score game where both teams will face adversity, the team that resets faster after mistakes holds a compounding edge.
The Rams are slightly sharper when clean (Cognitive-Motor Fidelity: 0.77 vs 0.76). But “when clean” is the operative constraint—and home field attacks that assumption directly.
ICP Verdict: Seattle adapts faster within game; Rams slightly faster pre-script.
VII. Home Field as Probability Mechanism
The Rams’ 52–54% neutral-field edge rests on a specific offensive sequence: early explosive conversions that establish rhythm before Seattle’s defense can layer pressure. Home field doesn’t add atmosphere—it degrades the precise metrics that sequence depends on.
The Degradation Chain
Step 1: Noise disrupts timing.
The Rams’ Explosive Conversion Rate (0.79) assumes clean protection and precise route timing. Lumen Field’s crowd noise forces silent counts, introducing pre-snap variability. The data already captures this: Rams Third-Down Efficiency Under Noise drops to 0.58—a 21-point degradation from general offensive rhythm. That’s structural vulnerability, not minor fluctuation.
Step 2: Timing disruption accelerates pressure accumulation.
Seattle’s Pressure Without Blitz rate (0.77) survives noise better than blitz schemes—four-man pressure doesn’t require complex coverage rotation. When the Rams’ timing slips, Seattle’s pass rush reaches Stafford without sacrificing coverage integrity.
Stafford’s stress threshold (10–12 pressured dropbacks) arrives faster in hostile environments where timing is already compromised.
Step 3: Degraded timing forces longer drives.
When explosives don’t hit, the Rams must sustain drives through the middle of the field. Their Disruption Sensitivity (0.63) indicates moderate vulnerability to accumulated pressure—enough to stall drives that would otherwise convert.
Longer drives mean more third downs. More third downs under noise means more exposure to that 0.58 efficiency rate. The math compounds.
Step 4: Recovery asymmetry decides close games.
Seattle’s +0.17 Recovery Resilience advantage amplifies when both teams face 2–3 adverse events, which a one-score game guarantees.
Quantified Probability Shift
Causation Vision validated that home field materially shifts leverage at 0.73 CSI—strong enough to clear the reliability gate.
Working through the degradation chain:

Net effect on win probability:
Net effect on win probability:
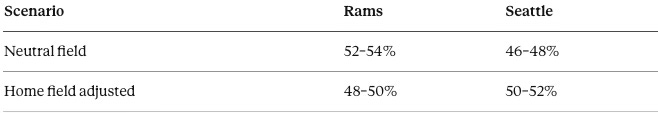
The shift is approximately 4–6 points—enough to move the game from slight Rams lean to true toss-up, but not enough to make Seattle a clear favorite.
Why It’s Still Not a Seattle Lean
Home field compresses the Rams’ ceiling. It doesn’t elevate Seattle’s floor.
Seattle’s vulnerabilities remain live:
Geno Smith’s Cognitive Load Coefficient (0.42) exceeds Stafford’s—hesitation against disguised coverage persists
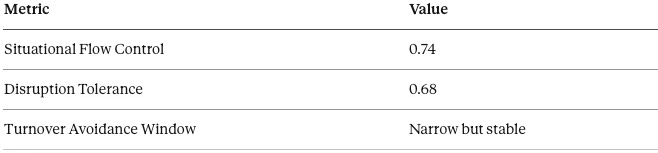
Turnover Avoidance Window is “narrow but stable”—stability isn’t margin
Offensive Situational Flow Control (0.74) is good, not dominant
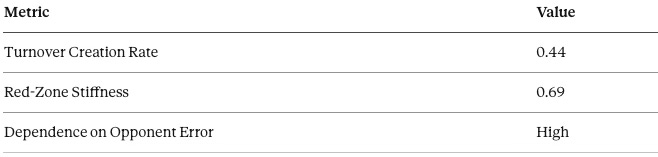
If Seattle gifts a possession through early turnover, home field can’t recover it. The Rams’ Turnover Creation Rate (0.44) can generate that opportunity, and their explosive capability—even degraded to 0.67—converts short fields.
VIII. How the Game Is Likely to Unfold
CDT metrics don’t predict specific plays—they identify the conditions under which systems succeed or fail. The quarter-by-quarter breakdown below translates those conditions into observable game states. Each phase carries key metrics that signal whether the game is trending toward Seattle’s compression model or the Rams’ tempo preference.
First Quarter
Los Angeles will test Seattle early—stretching the field and challenging coverage discipline, both to score and to quiet the stadium. Seattle will prioritize ball security and information gathering. Early offensive calls will skew conservative, designed to establish rhythm without exposing the quarterback to immediate risk.
The opening quarter is less about points than posture. If Seattle exits without gifting possessions, the game begins tilting toward its preferred shape.
Key metric to watch: Rams explosive attempts in first 12 snaps. If below 3, Seattle’s compression is working.
Second Quarter
The second quarter functions as the first leverage window. Seattle’s defense will layer disguise and pressure, forcing longer drives and more third downs. The Rams’ offense can survive this phase if timing remains perfect. If timing slips, field position quietly swings.
Seattle’s offense faces its first decision point. Continued excessive caution keeps the Rams within reach. Opening the intermediate passing game invites risk but creates the possibility of separation.
Key metric to watch: Stafford pressured dropback count. Approaching 8–10 by halftime indicates Seattle is on pace to trigger the stress threshold.
Third Quarter
Seattle’s greatest advantage appears after halftime. The Institutional Update Velocity gap (0.80 vs 0.73) manifests here—adjustments arrive quickly, and defensive pressure often peaks early in the third quarter. This is the most likely moment for a short field, a sudden score, or a momentum shift created by defense rather than offense.
If Seattle reaches the third quarter tied or trailing narrowly, the game remains structurally favorable. If Seattle trails by more than one score, the Rams’ offensive ceiling becomes harder to contain.
Key metric to watch: Third-quarter scoring differential. Seattle’s second-half adjustment advantage should manifest as +3 to +7 in this window.
Fourth Quarter
The fourth quarter will not be about volume. It will be about execution under noise. One red-zone trip that ends in a touchdown instead of a field goal may decide the game. One forced punt may do the same.
Seattle’s defense has proven capable of closing games. The offense must meet it halfway by converting at least once when opportunity appears.
Key metric to watch: Red-zone TD conversion on first fourth-quarter opportunity. Binary outcome with outsized leverage.
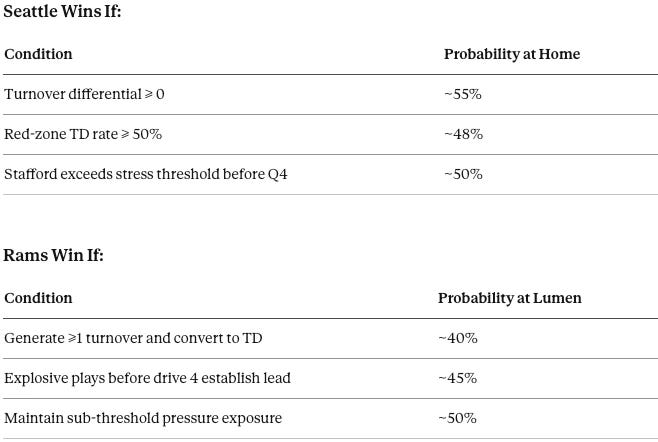
IX. Decision Surface
Win conditions reduce to specific, measurable thresholds. The tables below translate CDT analysis into binary checkpoints—conditions that, if met, shift probability decisively toward one team. Home field adjustments are already embedded in the probability estimates.
X. Disclosure Vision: Market Positioning
Markets price expectations based on available narratives, which often lag structural reality. Disclosure Vision measures the gap between what teams actually are and what consensus believes them to be. Significant latency gaps create value for observers who have calibrated against deeper system analysis.
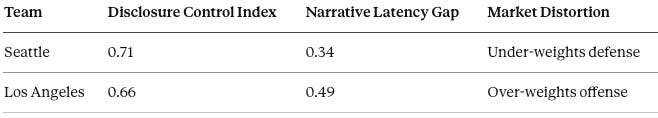
The market has not fully priced Seattle’s defensive transformation or the Rams’ noise vulnerability. This creates value on Seattle’s side of the line for those calibrating against consensus.
XI. Foresight Conclusion
Seattle can win without outscoring the Rams in a shootout. The path is quieter: protect possessions, let the defense compress the game, convert when field position presents opportunity. Los Angeles can win by accelerating early, forcing Seattle into urgency, and repeating the possession theft that decided the first meeting.
The rematch hinges on leverage, not momentum. One extra possession, one red-zone decision, one defensive stand—these will determine the outcome in front of a loud and unforgiving home crowd.
Final Integrated Projection:
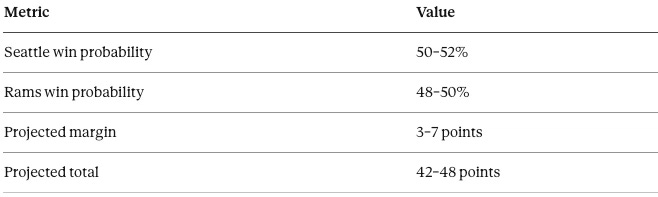
The game is a true toss-up because home field exactly offsets the Rams’ structural offensive advantage. Neither team has a reliable path to separation—only to survival.
Previous MCAI NFL and NCAA Vision Publications:
MCAI NFL Vision: Seahawks vs. Colts, Week 15 2025
MCAI NFL Vision: Seahawks vs. Texans, Week 7 2025
MCAI NFL Vision: Seahawks vs. Jaguars, Week 6 2025
MCAI NFL Vision: Seahawks vs. Buccaneers, Week 5 2025
MCAI NFL Vision: Seahawks vs. Cardinals, Week 4 2025
MCAI NFL Vision: Seahawks vs. Saints, Week 3 2025
MCAI NCAA Vision: 2025 Apple Cup, Washington v. Washington State
MCAI NFL Vision: Seahawks vs. Steelers, Week 2 2025
MCAI NFL Vision: Seahawks vs. 49ers, Week 1 2025
MCAI NFL Vision: Breaking the Cycle- A Simulation of the Seahawks Offensive Line (2024–2025), Commentary on Seattle Times Seahawks Analysis (Apr 2025)
MCAI NFL Vision: Too Much, Too Fast, Simulating Cognitive Breakdown in the Seahawks’ 2024 Defensive System (Apr 2025)
MCAI Sports Vision: Seahawks #80 Steve Largent, Quiet Excellence in Motion, A Simulation-Foresight Study in Multi Tier Intelligence and Civic Legacy (May 2025)
Seattle’s 38–37 win tracked closely with the foresight simulation: the game played as a true toss‑up, decided by a handful of leverage moments, with home field compressing the Rams’ offensive ceiling just enough for Seattle to survive.
## Outcome vs. Projected Probability Surface
- The simulation framed Rams as a slight neutral‑field favorite, with Lumen Field noise and Seattle’s recovery resilience shifting the matchup into a “true toss‑up,” not a clear Seattle lean.
- A one‑point Seahawks home win is almost a direct realization of that surface: neither team found sustainable separation, and the result effectively hinged on one extra possession and a single scoring decision late.
## Game Shape vs. Identity Claims
- Foresight positioned this as an identity conflict: Rams seeking early tempo and explosives; Seahawks seeking compression, turnover avoidance, and late leverage.
- The 38–37 profile reflects that clash: Los Angeles still reached a high point total, but did not blow the game open, while Seattle kept the game within strike range and was able to convert late leverage into the decisive margin.
## Home Field, Noise, and Stress Dynamics
- The model’s degradation chain argued that crowd noise would erode Rams’ third‑down efficiency and timing, accelerating Stafford’s pressure/stress thresholds and forcing longer, more fragile drives.
- The narrow outcome and lack of Rams separation inside a building where they had structural offensive advantages on paper is consistent with that mechanism: the Rams’ ceiling remained visible, but the path to actual dominance was structurally blocked by noise‑driven friction and Seattle’s defensive pressure profile.
## Institutional Plasticity and Late‑Game Execution
- The foresight work highlighted Seattle’s +0.17 Recovery Resilience and superior in‑game adaptation, especially after halftime, as the largest structural gap on the board.
- A one‑point win in a game that required Seattle to absorb adversity and still finish with precise late‑game execution matches that thesis: the differentiator was not raw talent but the ability to reset, adjust, and capitalize when the final high‑leverage window opened.
## Executive Takeaway
- From an exec lens, the simulation did not “call a score” so much as describe a decision space: narrow margin, no reliable blowout path, home field converting a slight structural Rams edge into a coin flip decided by noise, pressure, and recovery dynamics.
- The 38–37 Seahawks result is a strong validation of that framing: the realized game lived almost exactly where the foresight model said it would live—on the razor’s edge of one score, one possession, one red‑zone decision.