

MCAI National Innovation Vision: The Global Innovation Trap
Why Your R&D Investment Is Funding Competitors

See also MCAI National Innovation Vision: Foresight Simulation of NVIDIA H200 China Policy Exploits Vectors (Dec 2025).
Executive Summary
Innovation has shifted from a source of durable advantage to a structural financial liability. Companies now fund frontier R&D at full cost while competitors capture its benefits at a fraction of the investment. The leakage occurs not through espionage but through predictable channels—remote compute access, third-country transshipment, joint-venture knowledge transfer, and global talent mobility—that compress advantage windows from 8-10 years to 2-4 years.
This is no longer a compliance problem. It is a balance-sheet problem that distorts valuations, undermines national competitiveness, and erodes the economic case for frontier R&D. The speed and scale of capability absorption abroad are rewriting innovation economics across semiconductors, AI, clean energy, and advanced manufacturing. Firms that continue operating on decade-long exclusivity assumptions are building strategies—and valuations—on fiction.
This study quantifies the financial damage and shows why the 2025-2027 window defines whether U.S. industry adapts or enters long-term decline.
How This Study Builds on Parts I and II
This foresight simulation extends and operationalizes the findings from the first two studies in the series, converting their structural warnings into financial, strategic, and national-competitiveness analysis.
Part I (Aerospace’s Warning to AI, Nov 2025) established the foundational insight that capability access—not hardware ownership—is the true export boundary. It demonstrated how adversaries gain full developmental benefit through remote access, third-country infrastructure, and identity-layer gaps, providing the conceptual architecture of capability laundering.
Part II (Foresight Analysis in Illegal GPU Export Pathways, Nov 2025) mapped the real-world leakage topology, showing that multijurisdictional routing—Malaysia, Thailand, Indonesia—functions as a coordinated mesh rather than isolated violations. The study validated MCAI’s predictive model when DOJ indictments confirmed the exact pathways forecast seven days earlier.
This study (Part III) quantifies the economic and strategic cost of the mechanisms identified in Parts I and II. It demonstrates how the same leakage pathways compress advantage windows, erase R&D ROI, reshape supply-chain risk, and destabilize long-term national competitiveness.
Together, the trilogy moves from mechanism → topology → financial and strategic consequences.
Audience Guidance
For Companies: Your product roadmap assumes 8 years of advantage. Your competitor will replicate your breakthrough in year 3.
For Investors: Technology valuations assuming decade-long advantage periods are overvalued by 30-50%. Reprice accordingly.
For Universities: Publicly funded research is commercialized abroad faster than domestically. Licensing revenues decline even as research expenditures rise.
For the U.S. Government: Without structural reform, U.S. leadership stabilizes at 2-4 years of advantage rather than the historical 8-10.
Contact mcai@mindcast-ai.com to partner with us on US National Innovation Policy.
See also MCAI Economics Vision: Synthesis in National Innovation Behavioral Economics and Strategic Behavioral Coordination (Dec 2025) discusses the relationship between MindCast AI’s two fall 2025 economic frameworks.
I. The Financial Case: NVIDIA H100 as a $40B Lesson
Frontier R&D only works when exclusivity lasts long enough to recoup investment. NVIDIA’s H100 program—one of the most sophisticated and capital-intensive engineering efforts of the past decade—was built on an expected 8-year advantage. That assumption collapsed under the pressure of leakage pathways identified in Parts I and II of this series. The company invested $20-25B in the H100 architecture expecting nearly a decade of leadership. Instead, parallel compute access in Indonesia, diverted hardware through Malaysia and Thailand, and rapid reverse-engineering cycles in China compressed exclusivity to roughly two years.
The financial consequences were immediate:
Peak exclusivity delivered ~$45B revenue in 2023-2024.
By 2025, Chinese firms accessed thousands of H100/B200 GPUs remotely and via transshipment.
Huawei’s Ascend 910C reached ~70% of H100 performance at half the price.
China closed its domestic market to NVIDIA, eliminating ~$25-30B in annual opportunity.
Outcome:
Expected 2022-2030 revenue: ~$120B
Revised projection: ~$75B
Value transferred to competitors: ~$40-45B
The H100 case demonstrates the core economic truth of the Innovation Trap: without protection at the access layer, every dollar invested in frontier R&D produces diminishing domestic returns and accelerates foreign capability formation.
II. Cognitive Digital Twin Simulation Findings: National Innovation Foresight Analysis
This section translates the mechanisms identified in Parts I and II into a quantified foresight model—showing precisely why advantage windows collapse, how leakage dynamics propagate through national and corporate systems, and where decision-makers must intervene. MindCast AI’s Cognitive Digital Twin (CDT) architecture models each major actor—firms, regulators, national ecosystems, and third-country routing hubs—as autonomous but interacting cognitive systems. This simulation framework exposes structural weaknesses, coherence gaps, and incentive failures that traditional policy or financial analysis cannot surface. In all six CDT profiles, low CSI or low CCC scores reveal the core structural forces eroding U.S. advantage.
Understanding the Metrics
Causal Signal Integrity (CSI) is the core diagnostic for determining whether a system is designed for traceability or opacity.
CSI = (ALI + CMF + RIS) / DoC²
Action-Language Integrity (ALI): Measures whether an actor’s stated commitments match operational behavior. Low ALI indicates organizations declare controls they do not actually enforce.
Cognitive-Motor Fidelity (CMF): Tests whether decision logic is reflected consistently in real-world execution. Low CMF reveals procedural drift or deliberate evasion.
Resonance Integrity Signal (RIS): Tracks coherence across documentation, routing choices, ownership structures, and execution patterns. Low RIS reflects intentional fragmentation.
Degree of Complexity (DoC²): Complexity amplifies opacity. As routing chains add intermediaries, risk increases non-linearly.
A CSI below 0.05 indicates a chain engineered for evasion rather than incidental failure.
1. NVIDIA CDT
NVIDIA’s CDT shows a collapse from an 8-year advantage window to 2.5-3.2 years due to leakage channels identified in Parts I and II.
ALI: 0.42 (channel-control claims mismatch practice)
CMF: 0.51 (execution diverges across distributors)
RIS: 0.38 (documentation inconsistent across intermediaries)
CSI: 0.031 (opacity engineered into routing chain)
Implication: NVIDIA’s distribution architecture is optimized for scale, not verification. The CDT reveals structural vulnerability: even when NVIDIA’s internal controls strengthen, the multijurisdictional distributor network defeats traceability.
2. U.S. National Innovation CDT
U.S. national innovation governance exhibits strong intent but fragmented execution.
CCC: 0.47 (weak coherence across agencies)
CSI: 0.20 (policy intent undermined by inconsistent enforcement)
Implication: U.S. policy institutions pull in different directions—NSF funds open research, BIS writes restrictive export rules, DOD procures from vendors without supply-chain alignment, Treasury lacks outbound investment screening. Without unified policy coherence, national advantage compresses toward 2-4 years.
3. China National Innovation CDT
China demonstrates the highest systemic alignment in the CDT model.
CCC: 0.63 (policy → investment → execution alignment)
ALI: 0.71 (declared priorities match budget allocations)
CMF: 0.76 (execution fidelity strong)
Implication: China converts leaked capability into deployable systems at 1.8-2.5× U.S. speed. The CDT shows China reaching semiconductor and AI parity by 2029-2032, after which scale advantage and domestic demand produce price dominance.
4. Leakage Network CDT
The third-country routing ecosystem forms a self-healing mesh, not isolated violations.
Malaysia CSI: 0.07
Thailand: 0.09
Indonesia: 0.12
UAE: 0.16
Singapore: 0.41
Implication: When one corridor tightens, traffic re-routes within weeks. Each node appears legally compliant in isolation; the violation only emerges across the full chain, which few firms or agencies can trace.
5. Global Capital CDT
Global capital allocates based on outdated assumptions.
IV Score: 0.39
CCC: 0.44
Implication: Investors still price innovation as if advantage windows last 8-10 years. The CDT shows this creates 30-50% overvaluation in semiconductors, AI, deep-tech hardware, and frontier R&D firms. The repricing window tightens around 2026-2028.
6. Research University CDT
Universities generate high leakage and low domestic capture.
Leakage Index: 0.78
Domestic commercialization: 11-14%
ALI: 0.35
Implication: The open-research model, designed for an era of slow global diffusion, now accelerates foreign capability formation. Universities invest $500K-$2M per PhD in frontier science; foreign firms recruit them within months. Licensing revenue falls even as research output grows.
Key Findings
Advantage windows converge to 2-4 years. Pricing power collapses and R&D payback shortens.
Leakage vectors overwhelm firm-level defenses. Only national alignment can extend exclusivity.
Capital overvalues innovation by 30-50%. Repricing event likely 2026-2028.
China’s coherence (CCC 0.63) exceeds U.S. (0.47). Strategic gap widens annually.
Universities are high-leakage nodes. Global talent mobility transfers tacit knowledge instantly.
Access-layer controls are the only scalable defense. Hardware rules cannot contain distributed access.
III. How Innovation Value Flows to Competitors
Innovation value does not vanish—it migrates. The CDT findings in Section II quantify where advantage is lost; this section explains how it moves through the global system. Four leakage pathways dominate, each with distinct economics, timelines, and strategic consequences. Together, they form the operational architecture of the Innovation Trap: a world in which U.S. innovation becomes foreign capability at accelerating speed and declining cost.
Unified Leakage Architecture Table
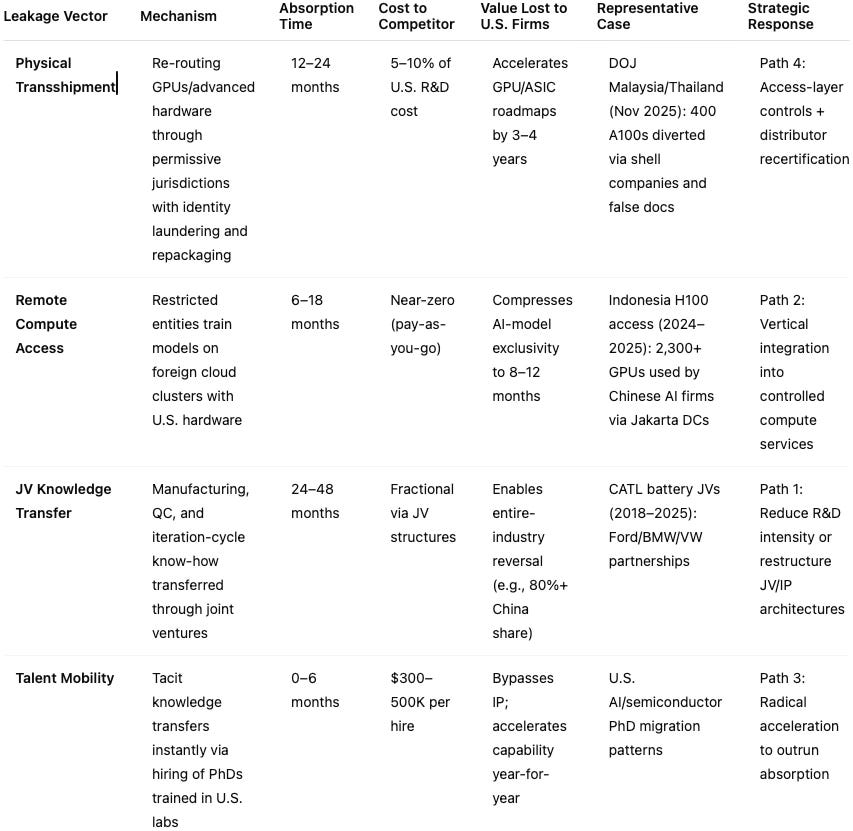
Case Study 1: Physical Transshipment (DOJ November 2025)
Four individuals routed 400 NVIDIA A100 GPUs through Malaysia and Thailand using falsified declarations, shell companies, and document repackaging. The chain operated as follows: U.S. origin → export misclassification to minimize scrutiny → Malaysia → repackaging and documentation swap to erase U.S. provenance → Thailand → new export declarations presenting hardware as regional export → China entry → no traceable link back to the U.S. Chinese engineers used the diverted GPUs to extract architectural insights—HBM-interposer routing, memory-controller strategies, tensor-core scheduling patterns, and thermal stack behavior—within 4-6 months. This accelerated domestic GPU programs by 3-4 years at roughly 5% of NVIDIA’s original R&D cost.
Case Study 2: Remote Compute Access (Indonesia 2024-2025)
Between late 2024 and mid-2025, more than 2,300 H100 and early-run B200-class GPUs were deployed to Indosat Ooredoo Hutchison data centers in Jakarta. Shanghai-based INF Tech authenticated into these clusters remotely to run fine-tuning and multimodal training workloads. Remote access delivers the same developmental benefit as physical chip possession. Many of the training runs would have violated U.S. export thresholds if executed on hardware located inside China. Development cycles compressed 2-3×, effectively eliminating the R&D exclusivity window NVIDIA expected. What was modeled as an 18-24 month lead became, in practice, a single-digit month advantage.
Case Study 3: JV Knowledge Transfer (CATL 2018-2025)
Western automakers entered joint ventures with CATL to access China’s EV market. These JVs gave CATL: detailed manufacturing-process specifications, quality-control protocols and failure-mode iteration data, battery-chemistry optimization cycles, and supply-chain integration and yield-management insight. This knowledge—impossible to replicate through reverse engineering alone—enabled CATL to unveil a 400Wh/kg solid-state battery in 2025. Western firms spent $30B over 15 years developing equivalent technology; CATL achieved parity in 7 years at roughly $4B. China now controls ~77% of global battery production, while U.S. and European firms share <15% combined. The JV model converted Western R&D into Chinese production advantage.
Case Study 4: Talent Mobility (Ongoing)
U.S. universities invest $500K-$2M training each PhD in frontier semiconductors and AI. Chinese firms recruit many of these graduates with $300-500K compensation packages. Knowledge transfer cycle: instantaneous. Tacit knowledge—design heuristics, debugging practices, optimization intuition, and system-level tradeoff reasoning—moves with the individual, not with patents or formal IP. Historical retention of Chinese STEM PhDs in the U.S. (1990-2015): 85-90%. Current retention (2023-2025): 60-70%, with the steepest declines in AI and semiconductors. U.S. universities generate more frontier research than ever, yet domestic commercialization lags. MIT reported a 24% decline in licensing revenue(2019-2024) despite increased research spending—an indicator that knowledge is being monetized elsewhere.
IV. Why Traditional Valuation Models Are Broken
Innovation no longer delivers the multiyear protection that traditional valuation models assume. Discounted cash flow frameworks price frontier technologies as if competitive advantage lasts 5-10 years, with premium margins persisting for most of that period. The CDT findings in Section II show a very different reality: in semiconductors, AI, and clean energy, true advantage windows have collapsed to 2-4 years, and in some cases to 8-12 months. Any model that ignores this compression quietly overstates enterprise value.
The Leakage-Adjusted Valuation Framework
A realistic valuation approach must modify three core assumptions at once:
Advantage duration: 8-10 years → 2-4 years
Premium revenue window: compressed by 50-65%
R&D amortization period: often longer than the remaining exclusivity window
The result is a 40-60% erosion in innovation-derived enterprise value, even when top-line revenue looks healthy.
Example: Semiconductor DCF Compression
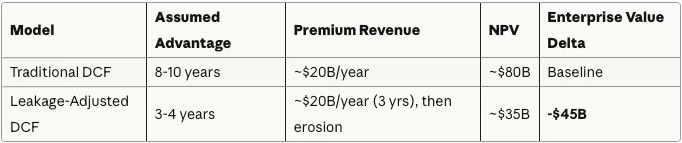
The revenue line hardly changes; the advantage window does. Once foreign competitors reach 70-85% of performance at half the price, premium margins evaporate and the back half of the DCF becomes fiction.
Sector-Specific Impact
Semiconductors: U.S. R&D ≈ $70B/year; Chinese R&D is now within $10-20B, growing faster. Advantage window: 3-5 years, trending toward <2 years by 2030. Investor implication: Firms priced for 8-10 year cycles are 30-40% overvalued.
Artificial Intelligence: Frontier model training costs: $200-500M per model. Real advantage: 8-12 months, not 18-24. Expected exits of $2-4B compress to $800M-$1.5B in realized value.
Clean Energy (Historical Precedent): Solar: $30-40B in Western R&D → 80%+ China market share; Western firms either bankrupt or niche. Batteries: $30B+ Western R&D → 77% of production centered in China; Western firms hold <15%. ROI: roughly -50-60% on Western innovation capital.
Bottom line: traditional valuation logic is a relic of a slower, more protected world. In the current environment, leakage physics, not legacy DCF assumptions, determine true enterprise value.
V. Red Flags: When R&D Investment Destroys Value
The CDT simulations surface a set of practical warning signals: patterns that show when innovation has flipped from generating advantage to subsidizing competitor capability. Once a critical mass of these signals appears, leaders should treat their R&D strategy and valuation assumptions as already compromised. Look for these patterns in your firm, sector, or portfolio. If three or more of these signals are present, you should assume that your R&D is actively subsidizing foreign capability.
Leakage and Capability-Absorption Red Flags
Shrinking time-to-competition: Time from your product launch to a credible competitor launch falls below 18 months and continues to compress.
Accelerating Chinese R&D in your domain: Chinese or aligned firms grow R&D spend faster than you do, signaling that foundational knowledge has already transferred.
Premium-price decay: Each new generation enjoys a shorter premium-pricing period than the last, despite better technical performance.
Market-access restrictions and localization pressure: The Chinese market closes, or “buy-local” rules in third countries start tilting procurement toward domestic or Chinese alternatives.
Talent outflow to foreign competitors: High-end engineers and PhDs leave for Chinese firms (or their proxies) even when you match cash compensation.
Third-country supply-chain routing: A growing share of hardware sales or workloads flows through Malaysia, Singapore, Indonesia, Thailand, or UAE—jurisdictions central to the leakage mesh.
Opaque JV and distributor ownership: Joint ventures, distributors, or integrators with unclear beneficial ownership, offshore structures, or silent partners embedded in the cap table.
Declining licensing revenue despite higher research output: Universities or corporate R&D labs publish more, file more patents, but earn less from licensing and commercialization.
Distributor churn and documentation anomalies: Frequent changes in middlemen, inconsistent paperwork, or recurring customs “reclassification” patterns.
Compute-access anomalies in cloud telemetry: Unusual high-intensity workloads originating from foreign data centers with weak governance or from customers with unclear end-users.
VI. Four Strategic Paths Forward
Once you accept that advantage windows are 2-4 years—not 8-10—you face a structural decision: change how you innovate, or accept a future of declining returns on every generation of technology. The four strategic paths below map to different leakage patterns and defensibility profiles. Each represents a coherent response to compressed advantage windows, with distinct tradeoffs in capital requirements, operational complexity, and long-term positioning. The right path depends on your balance sheet strength, sector dynamics, and tolerance for structural transformation.
Path 1: Accept Compressed Returns and Reduce R&D Intensity
In sectors where defensibility is structurally gone, the rational move is disciplined retrenchment.
Reduce R&D from 15-20% of revenue → 8-12%.
Shift from frontier breakthroughs to fast-cycle incremental improvements.
Emphasize cost efficiency, supply-chain resilience, and speed to market over technical maximalism.
Tradeoff: You protect near-term margins but accelerate long-run commoditization if competitors sustain higher innovation velocity.
Path 2: Vertical Integration into Controlled Deployment
If you cannot trust downstream environments, you must control them.
Audit all third-party distributors and partners for beneficial-ownership transparency.
Transition, where feasible, from chip or IP sales to compute-as-a-service under your direct operational control.
Implement identity-bound compute, geo-fenced execution, and training-intensity controls to bound what workloads can run and where.
Tradeoff: This strategy is capital intensive and operationally complex, but it maximizes defensibility and positions you as “trusted infrastructure” in an era of access-layer regulation.
Path 3: Radical Acceleration—Outrun the Absorption Rate
If leakage is inevitable, the only way to preserve leadership is to move faster than competitors can absorb.
Compress development cycles by 40-50% (e.g., from 24-36 months → 12-18).
Reallocate R&D toward iteration speed, modular designs, and rapid feedback loops.
Launch new architectures before competitors fully digest the last generation, accepting lower per-generation margins in exchange for cumulative leadership.
Tradeoff: Requires strong balance sheets, disciplined execution, and tolerance for volatility. Unsuitable for undercapitalized firms or those with weak internal coherence.
Path 4: Access-Layer Controls as Defensive IP Protection
This is the only scalable way to extend advantage windows in a globally distributed compute ecosystem.
Implement six-month distributor recertification tied to full beneficial-ownership audits.
Deploy workload identity logging and automated classification to detect export-controlled training.
Enforce geo-fenced execution zones for sensitive workloads and prevent unauthorized cross-border workload migration.
Integrate this regime into contracts with customers, partners, and cloud providers.
Outcome: Foreign absorption slows, regulators view you as a credible compliance counterparty, and your infrastructure becomes a preferred platform for customers who care about national-security alignment and long-term stability.
VII. The Investor Action Plan
Investors must recalibrate assumptions because shrinking advantage periods rewrite how technology value is created, defended, and priced. The CDT findings reveal systematic overvaluation across semiconductors, AI, and deep-tech hardware—driven by outdated assumptions about advantage duration. This section provides a practical framework for portfolio review and strategic repositioning over the next 12 months. The window for adjustment is narrowing: markets will reprice 2026-2028 as leakage dynamics become undeniable.
For immediate portfolio review, assess advantage duration trends by measuring time from product launch to credible competitor launch for each R&D-intensive holding and comparing current versus 5-year historical average (if shrinking more than 20%, major valuation concern exists). Quantify third-country exposure by determining what percentage of revenue flows through Malaysia, Indonesia, Singapore, Thailand, and UAE (if exceeding 15%, leakage risk is material). Evaluate talent retention by tracking engineer departures to Chinese competitors and monitoring retention rates for Chinese national employees (if retention declining more than 10% year-over-year, knowledge leakage is accelerating). Model compressed advantage periods by rerunning DCF models with advantage periods cut 40-50% (if current valuations assume 8-year advantages but reality is 3-4 years, position is overvalued 35-50%).
For strategic positioning over the next 12 months, reduce exposure to pure-play hardware companies with high China revenue exposure, deep-tech startups with 5+ year development timelines where advantage erodes before commercialization, companies with significant third-country supply chain complexity, and firms with more than 20% Chinese national engineering workforce. Increase exposure to software and services with strong network effects that remain defensible despite technology leakage, companies implementing vertical integration or access-layer controls, firms with rapid iteration cycles (12-18 month product cycles) that can outrun absorption, and companies with demonstrated pricing power despite Chinese competition. Consider new positions in compliance technology and supply chain verification services, domestic manufacturing and nearshoring enablers, and companies positioned for “trusted provider” status in emerging compute governance frameworks.
VIII. University and National Lab Reform
MIT’s technology licensing revenue dropped 24% (2019-2024) while research expenditures grew 12%—not a funding problem but a structural mismatch. Universities train PhDs in frontier technologies then watch those PhDs commercialize knowledge for foreign competitors within 6-18 months. The open-research model was designed for an era when commercialization took 5-10 years and happened domestically. That era is over. Across the top 50 U.S. research universities, technology licensing revenue declined 18% (2019-2024) while research expenditures grew 12%—ROI is declining rapidly.
The talent arbitrage is stark: universities invest $500K-2M training a semiconductor or AI PhD, Chinese companies recruit the graduate for $300-500K, knowledge transfers immediately, and university licensing revenue is zero. If licensing revenue continues declining, how do universities justify investment in applied research that primarily benefits foreign competitors? The answer is not restricting academic freedom but restructuring incentives through federal grants tied to commercialization commitments (NSF/DOE/DARPA funding should require domestic commercialization pathways, not just publication), industry partnerships with shared IP ownership (replacing one-way knowledge transfer with mutual value capture), and talent retention incentives (creating pathways for PhDs to commercialize in the U.S. through startup incubators and domestic hiring partnerships). Federal research funding is entering an era where ROI expectations and national interest shape grant eligibility—universities demonstrating stronger commercialization capture and reduced leakage risk will gain priority in funding cycles, while institutions that fail to adapt will see reduced grant competitiveness.
IX. Policy Lever Summary (For U.S. Government)
To restore multi-year advantage windows, the U.S. must activate a coherent set of national levers. Without unified execution across agencies, firms acting alone face asymmetric disadvantage because leakage operates through sovereign ecosystems, not corporate processes. The CDT findings in Section II quantify the cost of fragmentation: U.S. coherence (CCC 0.47) lags China (0.63), and this gap compounds annually. The following levers collectively reduce leakage, extend advantage windows, and align national R&D spending with strategic outcomes.
Compute-access licensing that regulates high-intensity AI training workloads rather than only hardware; identity-bound compute requiring verified workload identity for sensitive training; allied enforcement harmonizing export control and access governance with EU, Japan, Korea, and Taiwan; tech-transfer safeguards tying federal grants to domestic commercialization commitments; beneficial ownership transparency mandating disclosure for distributors and JV partners in third-country jurisdictions; and outbound investment review expanding screening for frontier technologies to restrict capital supporting competitor ecosystems. Implementation timeline: 2026-2027 represents the critical window before advantage erosion becomes irreversible.
X. Conclusion: The Innovation Paradox
The evidence is unequivocal: without structural adaptation, innovation becomes a liability—accelerating competitor progress rather than securing strategic advantage. The central paradox is stark: The more you invest in R&D under current conditions, the more you may be funding competitor capabilities. This doesn’t mean stop innovating—it means adjust expectations (model realistic advantage periods of 3-4 years, not 8-10), protect innovation value (implement access-layer controls, verify supply chains, control deployment), accelerate velocity (faster innovation cycles can outrun absorption rates), and restructure portfolios (shift toward defensible moats including network effects, vertical integration, rapid iteration).
For Decision-Makers
Corporate leaders: Your R&D ROI is declining. Either adapt strategy (Paths 1-4) or accept progressively lower returns on innovation investment.
Investors: Technology valuations assuming historical advantage periods are systematically overvalued by 30-50%. Markets will reprice 2026-2028 as leakage dynamics become undeniable.
Universities: The open research model is transferring publicly-funded knowledge to competitors faster than domestic commercialization. This is financially unsustainable and strategically corrosive.
U.S. Government: Without structural reform (access-layer controls, allied coordination, commercialization incentives), U.S. leadership stabilizes at 2-4 years of advantage rather than historical 8-10 years.
The Window for Action
2025-2027 represents the critical adaptation period. Companies and investors who adjust strategy now can protect innovation value. Those who assume “this time is different” or “it won’t happen to us” will watch R&D investments generate progressively weaker returns while funding the very competitors that erode their market position.
The innovation trap is real. The question is whether you recognize it before it destroys value—or after.