

MCAI Innovation Vision: SoftBank–DigitalBridge and the Capital–Energy–Trust Integration Regime Shift
Capital as Compute Throughput

I. Executive Thesis
AI advantage no longer turns on model quality or GPU access alone, but on the speed at which capital converts into energized, connected compute. The SoftBank–DigitalBridge transaction anchors this shift because SoftBank frames the deal as an operating infrastructure platform rather than a passive financial investment.
AI advantage has shifted from model quality and GPU access to capacity throughput —measured by Capital Conversion Rate (CCR) and Cycle Compression Index (CCI )—the speed at which capital converts into energized, permitted, and connected compute. SoftBank is not buying more chips; it is buying a platform that repeatedly converts capital into energized megawatts across geographies, as reflected in its stated goal of scaling next‑generation AI infrastructure through owned operating platforms (SoftBank press release, Dec. 29, 2025).
The SoftBank–DigitalBridge transaction marks the transition from capital‑as‑financing to capital‑as‑infrastructure. DigitalBridge already manages roughly $100B+ in digital infrastructure assets spanning data centers, towers, fiber, and edge platforms, giving SoftBank an immediately scaled, cross‑asset execution flywheel that directly maps to higher CCR and tighter CCI rather than a greenfield build‑up (DigitalBridge corporate overview).
The executive thesis reframes AI infrastructure competition as a throughput problem rather than a component‑supply problem. Framing the contest this way explains why control over platforms, timelines, and execution capacity now outweighs marginal advances in models or chips. This shift explains why platform ownership, balance‑sheet permanence, and execution coordination now dominate strategic value.
What makes the MindCast AI foresight simulation unique: Capital–Energy–Trust Integration (CETI) is the first framework that treats capital structure as an engineering variable in AI infrastructure—measuring platforms by how fast they convert dollars into energized megawatts, not by how much they deploy. The analysis inverts the standard narrative: SoftBank isn't buying scale, it's buying cycle time.
Capital permanence, energy coordination, and execution trust form a measurable AI‑infrastructure moat. The CETI framework operationalizes that moat using throughput metrics and observable proxies developed in Capital Is the New Computing (MindCast AI).
Insight: Capital becomes a competitive advantage only when it behaves like infrastructure—measured by time, throughput, and delivery reliability, not by dollars deployed.
II. Trigger Event and System Boundary
The empirical trigger for CETI is a structural shift in how AI infrastructure is owned and executed, requiring a clear boundary around the system under analysis. The analysis includes every binding constraint that determines AI infrastructure throughput.
Trigger: Take‑private acquisition of a global digital infrastructure GP—DigitalBridge—by SoftBank for approximately $4B enterprise value at $16 per share, approved by the DigitalBridge board and framed as a strategic move to scale AI data‑center infrastructure globally.
System Boundary:
AI data centers
Power generation, transmission, and interconnection
Fiber, towers, and edge connectivity
Capital origination, structuring, and recycling as an integrated system
Regulatory and municipal coordination
Key Question: Which actors can repeatedly clear energy, networking, and permitting bottlenecks faster than competitors?
Defining the boundary clarifies that AI infrastructure performance emerges from interactions among energy, networks, capital structure, and regulation—not from any single layer in isolation. Treating these elements as a coupled system prevents misdiagnosing coordination failures as technology shortages.
Insight: Once the full system boundary is acknowledged, coordination speed becomes the dominant competitive variable.
Contact mcai@mindcast-ai.com to partner with us on AI market foresight simulations.
III. Bottleneck Hierarchy Framework
Real‑world AI infrastructure delivery is governed by a small number of binding constraints that dominate time‑to‑capacity. Ordering these constraints reveals where throughput is actually won or lost.
Bottlenecks determine marginal compute output, not nominal GPU supply.
Hierarchy:
Energy availability and interconnection queues
Networking connectivity and latency envelopes
Cooling, density, and water constraints
Capital orchestration as the meta‑bottleneck governing all three
This ordering reflects observed constraints in large‑scale AI data‑center development, where power and interconnection delays dominate timelines (The Bottleneck Hierarchy in U.S. AI Data Centers (MindCast AI).
Foresight Simulation Focus: SoftBank–DigitalBridge represents a bet on owning the meta‑bottleneck of capital orchestration above energy, networking, and cooling, thereby multiplying downstream productivity.
Control over early bottlenecks amplifies the productivity of every downstream layer, while capital orchestration determines whether those controls can be exercised at scale. Platforms that lack orchestration authority remain exposed to delays even when physical assets are available.
Insight: The true moat sits above physical constraints, in the system that decides which constraints get cleared first.
IV. Capital as Compute Conversion Model
The capital‑as‑infrastructure thesis becomes operational only when expressed in measurable variables that allow comparison across platforms. Throughput metrics replace narrative claims about scale or permanence.
Capital behaves like a technical input when its structure determines time‑to‑capacity.
Core Metrics (Definitions and Observable Proxies)

These variables operationalize the argument that financing architecture functions as an engineering discipline rather than a passive funding layer (”Capital Is the New Computing,” MindCast AI).
All numeric CCR and CCI values referenced later are scenario priors, not measured outputs, pending future disclosures from platforms and operators.
Insight: The performance question is no longer “how much capital is available,” but “how quickly capital becomes energized compute.”
V. Trust Geometry and Execution Fidelity
Execution outcomes diverge sharply even among well‑capitalized infrastructure platforms. Repeat relationships and institutional memory determine how quickly coordination complexity collapses into delivery speed.
Trust converts coordination complexity into time savings by reducing negotiation friction, uncertainty, and rework across successive builds.
Execution Metrics (with observable proxies):
Action–Language Integrity (ALI): alignment between announced and delivered capacity; proxied by announced MW vs. in‑service MW within 24–36 months for named campuses.
Cognitive–Motor Fidelity (CMF): execution precision across multi‑asset builds; proxied by synchronization of data‑center delivery with fiber interconnect and power commissioning dates.
Resonance Integrity Score (RIS): repeatability of relationships; proxied by frequency of repeat campuses or follow‑on JVs with the same utilities or municipalities.
Causal Signal Integrity (CSI): reliability of inferred coordination advantages; proxied by whether stated levers consistently predict delivery outcomes.
DigitalBridge’s long‑standing relationships across data centers, fiber networks, and towers illustrate how geographic repeatability and regulatory familiarity can translate into faster execution.
Execution speed compounds when trust is institutionalized rather than rebuilt project by project. Institutional trust reduces negotiation friction and uncertainty across successive builds.
Insight: Time savings in AI infrastructure are often earned socially before they appear physically.
VI. Execution Throughput Model
Capital structure, asset adjacency, and regulatory throughput jointly determine whether structural advantages translate into delivered capacity under real‑world constraints.
Execution Outputs (Operational Interpretation)
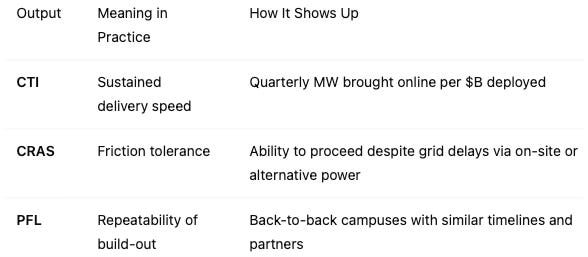
Platforms that absorb coordination risk outperform those that merely allocate capital. Carrying friction internally allows delivery schedules to hold under stress.
Insight: The durable advantage lies in who carries friction—not who avoids it.
VII. Comparative Platform Results (Directional)
Comparing leading infrastructure platforms using CETI‑derived scenario priors establishes a falsifiable ordering that can be tested against future disclosures.
This comparison relies on publicly observable execution patterns rather than audited measurements. The ordering represents scenario priors to be tested against MW additions, interconnection milestones, and capital deployment disclosures over time.
Platforms Evaluated:
SoftBank + DigitalBridge
Brookfield Infrastructure
Blackstone Infrastructure + Digital Realty
SoftBank (pre‑acquisition)
Capital Conversion Performance (Scenario Priors)
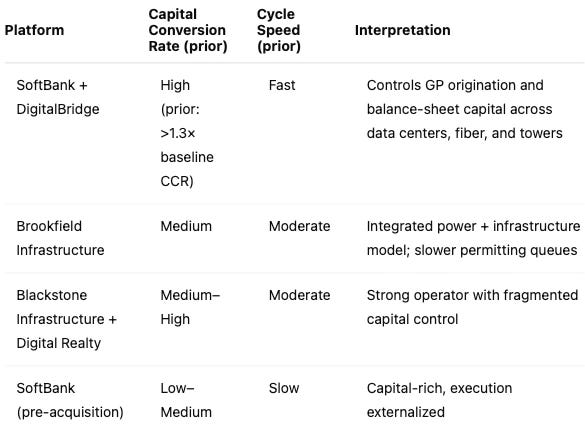
The ordering reflects differences in coordination control rather than differences in capital availability. Control over origination and sequencing explains why similar capital pools yield divergent outcomes.
Insight: Platform structure, not asset quality, explains throughput divergence.
VIII. Scenario Bands
Possible outcome paths diverge based on how effectively platforms clear coordination bottlenecks under stress. Execution resilience matters more than optimistic base cases.
Outcomes cluster around coordination throughput, not capital availability.
Base Expectation: Platform Flywheel for SoftBank–DigitalBridge, stress‑tested under energy price and permitting shocks.
Scenarios:
Platform Flywheel: repeatable campus builds with standardized financing
Hybrid Stall: strong origination, uneven power access
Coordination Drag: regulatory and grid delays dominate
Time Horizon: 12–36 months
Scenario divergence depends on institutional throughput, not on demand for AI compute. Stress conditions expose which platforms can sustain delivery when constraints tighten.
Insight: Stress reveals which platforms actually convert ambition into capacity.
IX. Testable Predictions
CETI becomes actionable only when converted into a concrete watch list for the next two years. Each prediction relies on observable disclosures rather than narrative interpretation.
CETI advantage manifests as measurable time and throughput deltas, not narrative superiority.
Primary Test Case: Stargate‑style multi‑gigawatt AI campus buildouts led by SoftBank‑backed consortia, with geography inferred from public reporting rather than confirmed site announcements.
Predictions (12–24 months):
CCR Outperformance: SoftBank–DigitalBridge delivers materially higher MW per $B per quarter than sponsor‑led peers.
Interconnection Compression: Median interconnection wait times shorten relative to regional benchmarks.
Execution Drift Gap: Variance between announced and delivered capacity remains materially lower than peers.
Disclosure Shift: Reporting pivots toward MW cadence, interconnection milestones, and power‑corridor control.
Comparator Baseline: Brookfield Infrastructure; Blackstone Infrastructure + Digital Realty hybrid model.
Falsification Contract: CETI fails if these indicators do not outperform comparators within the stated window.
Predictions transform CETI from an interpretive frame into a testable hypothesis set. Observable benchmarks anchor the framework in real‑world outcomes.
Insight: Foresight earns credibility only when it risks being wrong.
X. Second-Order Effects: Governance and Market Structure
CETI platforms reshape market structure and governance beyond individual projects by filling coordination gaps that markets and regulators leave unresolved.
CETI platforms force a governance realignment because no existing regulator oversees the capital–energy–compute stack end‑to‑end.
Mechanism: Coordination failures migrate from markets to platforms; platforms standardize permitting, interconnection, and financing playbooks in the absence of a unified regulatory authority.
Implications:
Rise of GP take‑privates and sovereign + tech‑capital consortia
De facto soft federalization of AI infrastructure norms
Emergence of single‑counterparty negotiation dynamics
Preference for capital providers that absorb regulatory latency risk
Fragility: Counterparty Concentration Risk
Risk Statement: CETI platforms can become choke points whose failure propagates system‑wide.
Failure Modes: rent extraction, balance‑sheet stress, governance drift, and regulatory backlash.
Platform centralization increases throughput but concentrates systemic risk. The same mechanisms that accelerate build‑out can magnify failure if governance or capital discipline erodes.
Insight: The same structure that accelerates build‑out can amplify failure.
XI. Conclusion
The CETI framework reframes AI infrastructure competition as a systems problem rather than a technology race. The SoftBank–DigitalBridge deal serves as an early, visible example of this shift.
AI leadership now depends on who can integrate capital, energy, and trust into a coherent execution platform. Competitive advantage flows to institutions that deliver capacity reliably under real‑world constraints, not to those that merely promise scale. Capital no longer follows compute; capital becomes compute throughput.
Insight: The future of AI will be decided less by models than by the institutions that deliver power, connectivity, and capacity on time.