

MCAI Market Vision: AI Infrastructure, Priority Under Scarcity
How Hyperscaler Nuclear PPAs Function as Capacity-Preemption Protocols in the AI Era

I. Executive Summary
Microsoft’s twenty-year power purchase agreement with Constellation Energy to restart Three Mile Island Unit 1 represents more than a clean-energy procurement deal. The arrangement establishes a template for how hyperscale technology firms secure priority access to scarce, firm, carbon-free generation capacity before regulators, municipalities, and industrial users recognize that allocation has already occurred. Amazon, Google, and Meta have executed or announced comparable arrangements, signaling that capacity preemption through long-term contracts has become the dominant strategy for AI-era energy procurement.
The MindCast AI Cognitive Digital Twin (CDT) simulation models ten actor classes across eleven proprietary Vision Functions to forecast how allocation, opposition, and correction unfold between 2026 and 2032. The simulation reveals a consistent temporal asymmetry: hyperscalers contract at speeds that outpace institutional adaptation, opposition activates only after allocation crystallizes, and regulatory correction arrives too late to reverse lock-in. Firm clean megawatts are becoming a pre-booked asset class, and the political conflict over who pays for grid reliability will intensify as scarcity deepens.
Document Roadmap
Sections I–III establish the thesis, methodology, and Vision Function framework.
Sections IV–XIII analyze ten actor classes:
primary initiator (Microsoft),
fast followers (Amazon, Google, Meta),
supply-side allocators (Constellation Energy),
allocation engines (PJM),
federal regulator (FERC),
state-level surface (PUCs),
displaced public loads (municipalities),
industrial load, opposition catalyst (state attorneys general), and
capital accelerant (infrastructure funds).
Section XIV presents the constraint hierarchy that limits scale.
Section XV projects the 2026–2032 arc across four phases.
Section XVI specifies six falsifiable predictions. Section XVII synthesizes implications.
Prediction Summary
The simulation generates six testable predictions:
(1) at least two additional hyperscalers secure ≥300 MW of firm clean capacity by 2028;
(2) public controversy shifts from greenwashing to rate and reliability impacts by 2027;
(3) front-of-the-meter PPA structures entrench as the survivable regulatory template;
(4) municipal decarbonization loses optionality first, triggering coalition formation by 2027;
(5) queue leverage becomes contested in at least one proceeding by 2026; and
(6) the carbon accounting gap between portfolio claims and local emissions becomes litigable by 2029.
II. Core Thesis
Hyperscaler nuclear power purchase agreements function as capacity-preemption protocols rather than climate transactions. By underwriting the restart or life-extension of firm nuclear assets through long-term, grid-connected contracts, technology firms separate energy geography from compute geography. The grid becomes an abstraction layer, and long-dated agreements—not transmission lines—determine priority access. The dynamic mirrors how spectrum auctions pre-assign scarce bandwidth years before consumers notice coverage gaps (for the broader framework on how AI shifts value toward infrastructure bottlenecks, see MindCast AI, “MCAI Market Vision: The Phase Transition in AI Infrastructure Value Shift,” December 2025). Microsoft did not solve the power shortage; Microsoft solved who receives priority under shortage.
The expanded thesis clarifies the distributional stakes. As hyperscalers pre-book the scarcest clean megawatts through Power Purchase Agreements (PPAs), interconnection leverage, and portfolio accounting, other large loads face a repriced and constrained forward curve for firm clean power. Municipalities pursuing decarbonization targets, public transit authorities electrifying fleets, and industrial users requiring reliable baseload all compete for a diminishing residual pool. The political conflict arrives later, but the allocation happens first.
Contact mcai@mindcast-ai.com to partner with us on AI infrastructure foresight simulations. See also AI Computing Is Now Federal Infrastructure (Nov 2025), Building CRE Coherence for AI Infrastructure (Nov 2025), Predictive Cognitive AI and the AI Infrastructure Ecosystem (Oct 2025), The Bottleneck Hierarchy in U.S. AI Data Centers (Aug 2025).
III. Methodology: Cognitive Digital Twin Simulation
The CDT simulation methodology models institutional actors as cognitive agents with measurable behavioral signatures. Each actor receives a profile constructed from publicly observable actions, structural constraints, and incentive architectures. Vision Functions—analytical lenses calibrated to specific coordination dynamics—generate quantitative metrics that reveal alignment, drift, and adaptation capacity across the system. Eleven Vision Functions structure the present simulation: six core functions that apply broadly, and five specialized functions that target specific actor classes.
Core Vision Functions
Strategic Behavioral Coordination Vision (SBC Vision) measures intent clarity, behavioral coherence, and coordination thresholds.
Becker Vision assesses rational exploitation of institutional lag and incentive alignment.
Coase Vision evaluates coordination capacity, focal-point integrity, and trust density across market institutions.
Institutional Cognitive Plasticity Vision (ICP Vision) quantifies adaptation velocity and legacy inertia.
Posner Vision models enforcement lag, correction feasibility, and doctrinal fragmentation.
Causation Vision tests causal attribution accuracy and distinguishes signal from noise.
Specialized Vision Functions
Venture Integrity Vision (VIV) assesses counterparty risk tolerance, venture coherence, and future-capture incentives for supply-side actors.
Coherence Governance and Regulation Vision (CGR Vision) measures policy coherence, recursive learning capacity, and narrative stability under stress for regulatory bodies.
Disclosure Vision evaluates action-language integrity, narrative inversion risk, and enforcement timing for actors positioned to challenge marketing-versus-reality gaps.
Investment Vision (IV) quantifies capital deployment speed, concentration dynamics, and macro value gradients for financial actors.
Coordination and Capital Concentration Vision (CCC Vision) models how capital flows coordinate with or accelerate institutional lock-in.
The simulation assigns each actor class a primary Vision Function stack, derives metrics from observed behavior, and projects forward trajectories under scarcity conditions. Metric scores represent normalized simulation outputs derived from observed behavior and structural constraints, not direct empirical measurements. Predictions include explicit falsification criteria to enable validation against future outcomes.
IV. Actor Analysis: Primary Initiator
The capacity-preemption pattern originated with a single actor whose strategic positioning, balance-sheet capacity, and temporal horizon enabled first-mover execution. Microsoft’s September 2024 agreement with Constellation Energy established the template that competitors subsequently replicated. The CDT simulation assigns Microsoft the highest Strategic Intent Score among all modeled actors, reflecting coherent long-term planning rather than opportunistic deal-making. Understanding the primary initiator’s behavioral signature clarifies why followers adopted the same playbook rather than alternative procurement strategies.
Microsoft
Microsoft operates as the primary initiator of the capacity-preemption template. The firm’s September 2024 agreement with Constellation Energy secured the entire 835-megawatt output of Three Mile Island Unit 1 through 2048, with an estimated contract value of sixteen billion dollars. Microsoft’s data centers in Pennsylvania, Virginia, Ohio, and Illinois—distributed across 150 to 600 miles from the generation source—claim the power through grid-connected settlement rather than physical co-location. The structure demonstrates that compute geography and energy geography need not coincide when contracts mediate allocation.
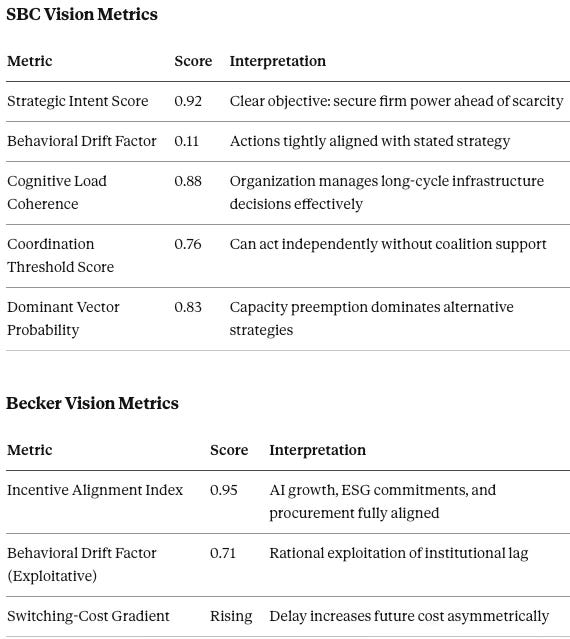
The SBC Vision output confirms that Microsoft acts with high strategic coherence and minimal behavioral drift. The Becker Vision output reveals that waiting imposes rising costs, which explains the premium pricing Microsoft accepted—reportedly ninety-eight dollars per megawatt-hour against market prices near fifty dollars. Microsoft will likely execute two to four additional firm or near-firm PPAs by 2028, maintaining a technical and quiet narrative posture throughout.
V. Actor Analysis: Fast Followers
Once Microsoft demonstrated that long-term nuclear PPAs could survive regulatory scrutiny while securing firm clean capacity, peer hyperscalers faced a straightforward decision calculus. The expected value of following exceeded the expected value of hedging or pursuing alternative strategies. The CDT simulation models Amazon, Google, and Meta as a composite fast-follower cohort whose collective behavior validates the preemption template and accelerates supply exhaustion. Each firm brings comparable balance-sheet capacity and organizational sophistication, making replication feasible within months of the Microsoft announcement.
Amazon, Google, and Meta
Amazon, Google, and Meta constitute the fast-follower cohort. Amazon secured long-term offtake exposure tied to Susquehanna output through 2042, following regulatory resistance to expanded co-location structures, and pursues small modular reactors in Pennsylvania. Meta announced a twenty-year, 1.1-gigawatt agreement with Constellation Energy for output from the Clinton Clean Energy Center in Illinois. Google contracted Kairos Power for 500 megawatts of advanced modular reactor capacity by 2035 and engaged Elementl Power to prepare multiple sites for advanced nuclear installations. Each firm replicates the Microsoft template with minor structural variations.
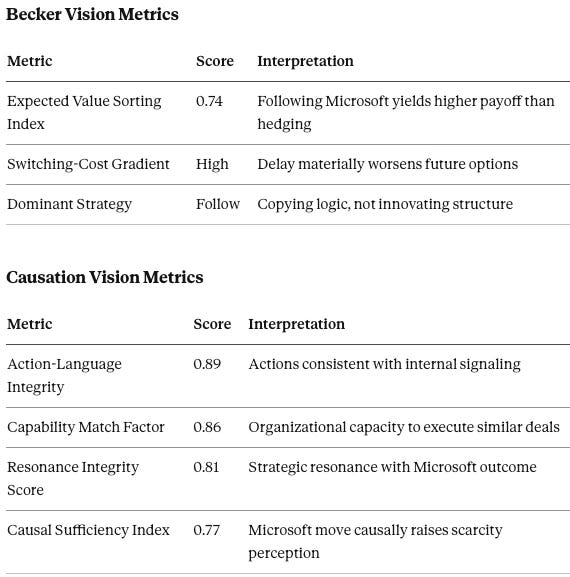
The Causation Vision output confirms that Microsoft’s deal functions as a causal trigger for peer behavior, not merely a correlated signal. The Expected Value Sorting Index indicates that following dominates hedging, but finite supply constrains how many followers can actually secure equivalent capacity. At least two peers will complete capacity-preemptive arrangements of 300 megawatts or greater by 2027–2028, exhausting much of the near-term restartable inventory.
VI. Actor Analysis: Supply-Side Allocators
Capacity-preemption protocols require willing counterparties on the supply side. Nuclear operators holding restartable or life-extendable assets face a choice between merchant-market exposure and long-term contracted offtake. The CDT simulation models supply-side allocators through Venture Integrity Vision, which assesses counterparty risk tolerance, venture coherence, and future-capture incentives. Constellation Energy emerges as the dominant allocator, having executed the Microsoft, Meta, and federal government deals that define the current market structure.
Constellation Energy
Constellation Energy operates as the dominant supply-side allocator in the nuclear PPA market. The firm controls Three Mile Island, Clinton, and other nuclear assets positioned for life-extension or output reallocation. Constellation’s business model incentivizes long-term, single-counterparty agreements that monetize scarcity while reducing merchant-market exposure. The Microsoft deal reportedly commands a forty-to-fifty-dollar premium above market clearing prices, demonstrating the value Constellation extracts from capacity constraints.
Venture Integrity Vision Metrics
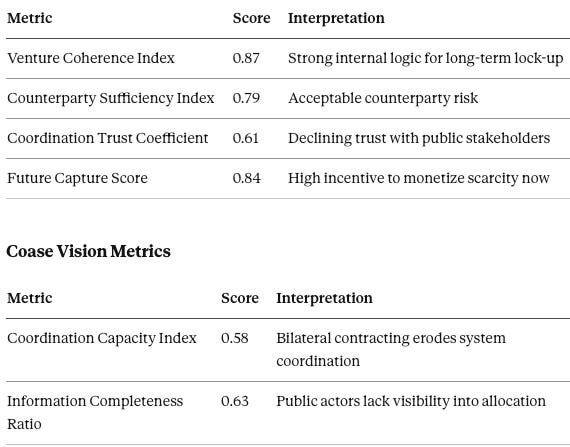
The declining Coordination Trust Coefficient signals emerging reputational risk as public awareness of allocation dynamics increases. Constellation and peer nuclear operators will favor single-counterparty PPAs until reputational or regulatory costs rise materially, likely triggered by rate-case proceedings that attribute cost increases to hyperscaler-driven capacity lock-ups.
VII. Actor Analysis: Allocation Engines
Grid operators and regional transmission organizations function as allocation engines—the institutional infrastructure through which contracts translate into physical power flows and market settlements. These entities did not design their rules for hyperscaler-tempo contracting or AI-scale load growth. The CDT simulation applies Coase Vision, ICP Vision, and Posner Vision to assess whether allocation engines can coordinate competing claims or whether bilateral contracts will outrun institutional capacity. The Pennsylvania-Jersey-Maryland Interconnection concentrates the highest density of hyperscaler nuclear PPAs and faces the earliest coordination stress.
Pennsylvania-Jersey-Maryland Interconnection
The Pennsylvania-Jersey-Maryland Interconnection (PJM) operates as the primary allocation engine for the region where hyperscaler nuclear PPAs concentrate. PJM manages the grid serving thirteen states and the District of Columbia, coordinates interconnection queues, and administers capacity markets. The Microsoft, Amazon, and Meta deals all settle through PJM, making the regional transmission organization the institutional bottleneck where allocation conflicts will surface first.
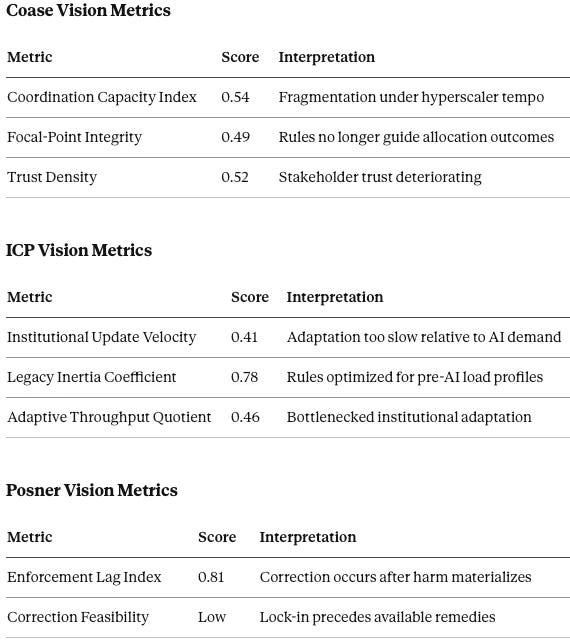
The Coase Vision scores—all below 0.55—indicate that PJM no longer functions effectively as a coordination mechanism. Bilateral contracts outrun rule-making tempo, and queue disputes will intensify as hyperscaler-aligned capital finances upgrades that accelerate preferred projects. PJM becomes the first major flashpoint for contested proceedings framed around queue manipulation and congestion cost allocation.
VIII. Actor Analysis: Federal Regulator
Federal regulatory posture determines which deal structures survive and which face rejection or restructuring. The capacity-preemption protocol’s viability depends on navigating federal jurisdiction without triggering adverse rulings that would unwind contractual arrangements. The CDT simulation applies Posner Vision and ICP Vision to model enforcement lag, doctrinal fragmentation, and the capacity of sophisticated actors to structure around early correction. Federal regulatory tolerance shapes the design space within which hyperscalers and nuclear operators can operate.
Federal Energy Regulatory Commission
The Federal Energy Regulatory Commission (FERC) holds jurisdiction over wholesale electricity markets, transmission, and certain interconnection structures. FERC denied the original Talen-Amazon co-location proposal, signaling regulatory resistance to behind-the-meter arrangements that bypass grid cost allocation. The Microsoft-Constellation structure—front-of-the-meter, grid-connected, and non-preferential on paper—represents the template that survives FERC scrutiny.
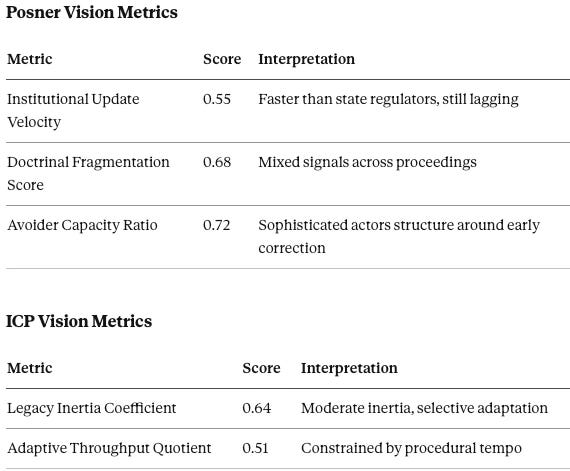
The Avoider Capacity Ratio reveals the core dynamic: hyperscalers and their legal advisors structure deals to satisfy FERC requirements while capturing priority access. FERC will entrench front-of-the-meter survivability as the permissible template and focus enforcement on ex post mitigation rather than preventive allocation rules. Doctrinal fragmentation across proceedings creates ambiguity that sophisticated actors exploit.
IX. Actor Analysis: State-Level Surface
State regulators exercise jurisdiction over retail rates, siting, and cost allocation—the domains where hyperscaler capacity preemption eventually surfaces as ratepayer impact. Unlike federal regulators, state bodies operate closer to constituent pressure but farther from wholesale market mechanics. The CDT simulation applies ICP Vision and Coherence Governance and Regulation Vision to assess adaptation velocity and policy coherence under stress. State regulators possess corrective power but activate late in the allocation cycle, after contracts have closed and capacity has been assigned.
State Public Utility Commissions
State Public Utility Commissions (PUCs) in Pennsylvania, Virginia, Ohio, and Illinois exercise jurisdiction over retail rates, siting, and certain cost-allocation determinations. PUCs possess corrective power but activate late in the allocation cycle. Rate cases provide the primary venue where hyperscaler-driven costs surface in regulatory record, but proceedings unfold over months or years while contracts close in weeks.
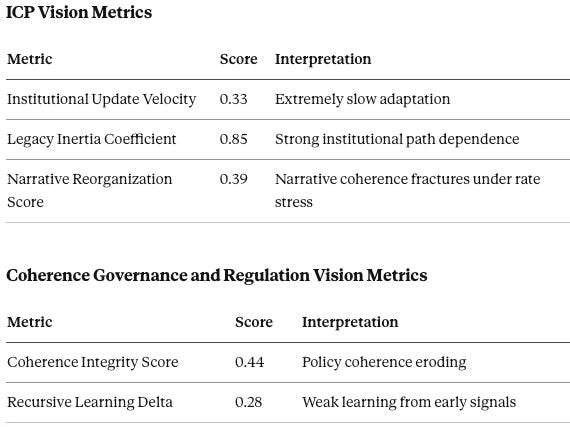
The Institutional Update Velocity spread tells the structural story: Microsoft operates at 0.92; PJM adapts at 0.41; state PUCs respond at 0.33. Contracts close in the 0.92 tempo; correction arrives in the 0.33 tempo; allocation happens in the gap. State PUCs will impose special tariffs, moratoria, or AI-specific siting rules by 2026–2027, but these measures arrive after major capacity allocations crystallize.
X. Actor Analysis: Displaced Public Loads
Capacity preemption produces winners and losers. Public-sector entities pursuing decarbonization compete for the same finite pool of firm clean megawatts that hyperscalers lock up through long-term contracts. The CDT simulation models displaced public loads through SBC Vision, assessing coordination capacity, frustration drift, and causal attribution accuracy. These actors cannot match hyperscaler creditworthiness or contract sophistication, creating structural disadvantages that compound as available supply diminishes.
Municipal Governments and Public Authorities
Municipal governments and public authorities pursuing decarbonization face asymmetric disadvantages in competing for firm clean capacity. Cities cannot match hyperscaler creditworthiness, absorb twenty-year take-or-pay risk, or deploy sophisticated energy procurement teams. Public transit authorities electrifying bus fleets, municipal utilities serving residential load, and state agencies pursuing carbon-neutral operations all draw from the same constrained pool of firm clean megawatts.
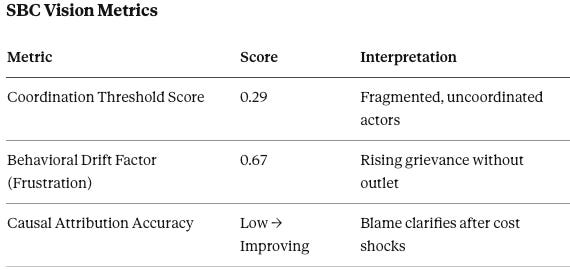
Municipal actors organize late because fragmentation prevents early coordination and causal attribution remains unclear until rate increases or reliability events crystallize blame. Coalition formation accelerates abruptly once costs materialize—likely through joint-procurement authorities or legislative requests for priority access. The “AI took our power” narrative gains traction when a sympathetic protagonist (a city, a transit system, a hospital network) publicly announces inability to meet decarbonization targets due to firm clean supply constraints.
XI. Actor Analysis: Industrial Load
Large industrial users occupy an intermediate position between hyperscalers and public-sector entities. Manufacturing facilities, chemical plants, and data-intensive operations outside the hyperscaler tier require reliable baseload and increasingly compete for constrained firm clean capacity. The CDT simulation applies Becker Vision and Coase Vision to model industrial response dynamics. Trade associations provide coordination infrastructure that public actors lack, enabling collective action once repricing or reliability impacts materialize.
Large Industrial Users
Large industrial users—manufacturing facilities, chemical plants, data-intensive operations outside the hyperscaler tier—possess greater leverage than municipalities but face similar repricing dynamics. Industrial users require reliable baseload, cannot tolerate production disruptions from grid instability, and increasingly compete for the same firm clean capacity that hyperscalers lock up through long-term PPAs.
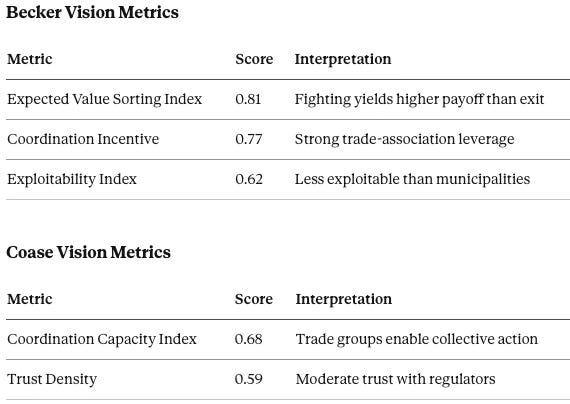
Industrial users activate later than hyperscalers but earlier than municipalities, and trade associations provide coordination infrastructure that public actors lack. Industrial coalitions will push for special rate classes, carve-outs, and priority-access frameworks by 2027. When industrials mobilize, regulators listen—the political economy favors actors who threaten job losses and production relocation over actors who threaten missed climate targets.
XII. Actor Analysis: Opposition Catalyst
Opposition to capacity preemption requires a catalyst—an actor with legal tools, political incentive, and narrative leverage to challenge the gap between hyperscaler marketing claims and physical reality. The CDT simulation applies Disclosure Vision and Posner Vision to identify which actors possess the standing, doctrinal anchoring, and activation triggers to convert latent grievance into enforcement action. State attorneys general emerge as the most likely opposition catalysts, combining consumer-protection authority with responsiveness to public pressure.
State Attorneys General
State attorneys general emerge as opposition catalysts when the gap between marketing claims and physical reality becomes politically salient. Hyperscalers claim “100% carbon-free energy” based on portfolio accounting and PPA attribution, but the data centers physically drawing power in Virginia or Ohio consume grid electrons with marginal emissions determined by local dispatch. The accounting-versus-physics gap invites disclosure challenges, consumer-protection actions, and securities scrutiny.
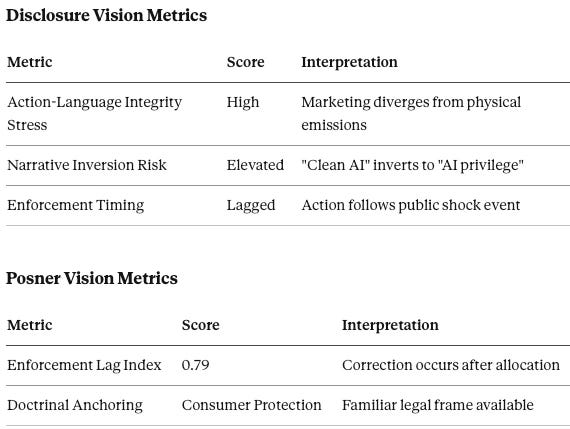
State attorneys general possess familiar legal tools (consumer protection, disclosure requirements) and respond to public pressure more directly than economic regulators. Enforcement actions testing the gap between accounting-based carbon claims and local emissions profiles will emerge by 2027–2029, likely triggered by investigative journalism or NGO research documenting the divergence.
XIII. Actor Analysis: Capital Accelerant
Capital flows amplify the capacity-preemption dynamic by financing queue positions, transmission upgrades, and generation assets aligned with hyperscaler demand. Infrastructure funds and energy-focused private equity deploy faster than regulatory adaptation, and fund mandates increasingly favor assets with contracted hyperscaler offtake. The CDT simulation applies Investment Vision and Coordination and Capital Concentration Vision to model how capital accelerates allocation tempo. Capital functions as an accelerant rather than an independent strategic actor, reinforcing lock-in through financing structures that favor creditworthy counterparties.
Infrastructure Capital
Infrastructure funds and energy-focused private equity accelerate the capacity-preemption dynamic by financing queue positions, transmission upgrades, and generation assets aligned with hyperscaler demand. Capital deploys faster than regulatory adaptation, and fund mandates increasingly favor assets with contracted hyperscaler offtake. The feedback loop reinforces lock-in: hyperscaler creditworthiness attracts capital, capital accelerates preferred projects, accelerated projects lock up capacity, and locked capacity raises barriers for later entrants.
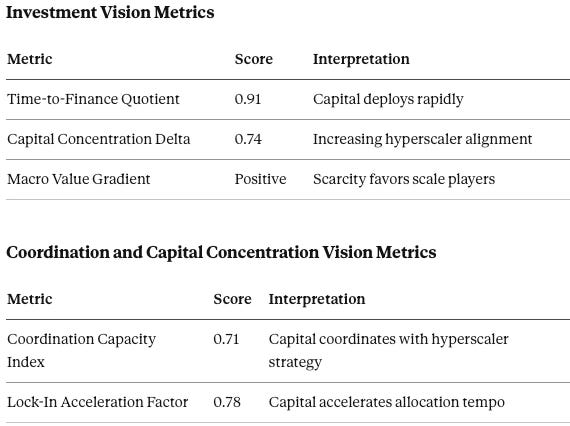
Infrastructure capital functions as an accelerant rather than an independent actor. Fund managers optimize for contracted cash flows with creditworthy counterparties; hyperscaler PPAs satisfy both criteria. Capital will continue accelerating queue leverage and firm-capacity lock-ups until regulatory intervention raises transaction costs or reputational risks materially.
XIV. Constraint Hierarchy: What Actually Limits Scale
The CDT simulation identifies five constraints that limit hyperscaler capacity preemption, ordered by binding force rather than political salience. Politics ranks fourth, not first—a non-obvious finding that explains why opposition activates late and correction arrives after allocation.
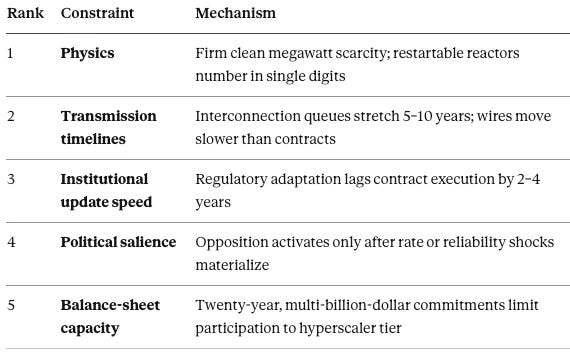
The hierarchy clarifies why the capacity-preemption protocol succeeds: hyperscalers exploit the gap between constraints one and two (which bind them) and constraints three and four (which would constrain them if institutions moved faster). Constraint five functions as a moat rather than a limit—it excludes competitors, not hyperscalers.
XV. Integrated Forecast: 2026–2032
The CDT simulation projects a seven-year arc characterized by early private preemption, delayed public backlash, and partial regulatory correction after allocation crystallizes.
2026–2027: Allocation Phase
Hyperscalers complete the bulk of restartable nuclear PPAs and secure life-extension commitments from operating plants. Queue disputes surface at PJM as hyperscaler-aligned projects receive accelerated treatment. State PUCs initiate proceedings examining data-center cost allocation. Municipal coalitions begin forming in response to firm clean supply constraints.
2027–2028: Opposition Activation Phase
Rate cases explicitly attribute cost increases to hyperscaler-driven transmission and capacity requirements. At least one contested interconnection proceeding frames the dispute as “big tech jumped the queue.” Industrial trade associations demand special rate classes. Consumer advocates and state attorneys general announce investigations into carbon-accounting practices.
2028–2030: Partial Correction Phase
Regulatory frameworks harden around front-of-the-meter structures while restricting bespoke co-location and behind-the-meter arrangements. State legislatures impose special tariffs, moratoria, or AI-specific siting requirements. Disclosure actions test the gap between portfolio carbon claims and local emissions. Municipal joint-procurement authorities emerge in multiple states.
2030–2032: Equilibrium Phase
Firm clean megawatts function as a pre-booked asset class with hyperscaler priority embedded in contract structures. Small modular reactors begin commercial deployment but cannot scale fast enough to relieve near-term constraints. SMRs alter the post-2032 trajectory but do not relieve the 2026–2030 scarcity window modeled here. Political conflict stabilizes around rate allocation and reliability rather than climate virtue. Two-tier carbon reality persists, with accounting-based claims diverging durably from physical emissions profiles.
XVI. Predictions with Falsification Criteria
The simulation generates six testable predictions with explicit falsification conditions.
Prediction 1: Capacity Preemption Becomes Default Playbook
By 2028, at least two additional hyperscalers secure long-term claims on large blocks (≥300 MW) of firm or near-firm clean capacity through nuclear life-extension, restart, hydro, geothermal, or synthetic baseload portfolios.
Falsification: No new hyperscaler deals reserving ≥300 MW of firm or near-firm clean capacity by end of 2028.
Prediction 2: Rate and Reliability Conflict Displaces Greenwashing Narrative
Public controversy consolidates around cost allocation, congestion, and reliability impacts rather than abstract greenwashing claims. The dominant narrative becomes: “AI secured priority access; everyone else absorbed system costs.”
Falsification: State PUCs, attorneys general, or consumer advocates do not explicitly link data-center procurement to local rate or reliability impacts by end of 2027.
Prediction 3: Front-of-the-Meter Rules Entrench
Regulatory tolerance hardens against bespoke co-location and behind-the-meter structures while grid-connected, settlement-based PPAs become the survivable template for hyperscaler nuclear procurement.
Falsification: FERC or state regulators approve major co-location or behind-the-meter structures for hyperscaler loads after 2026.
Prediction 4: Municipal Decarbonization Loses Optionality First
Cities, transit agencies, and public institutions face pricing or availability constraints that delay or prevent decarbonization targets, leading to carve-out requests, joint-procurement coalitions, or legislative appeals for priority access.
Falsification: No public-sector procurement coalitions or legislative requests for priority access emerge by end of 2027.
Prediction 5: Queue Leverage Becomes Contested
Hyperscalers and aligned infrastructure funds finance upgrades or restructure queue positions in ways that accelerate preferred projects, generating at least one contested proceeding framed as queue manipulation or preferential treatment.
Falsification: No contested interconnection proceeding references hyperscaler queue advantage by end of 2026.
Prediction 6: Carbon Accounting Gap Becomes Litigable
A durable split emerges between portfolio-level carbon-free claims and local physical emissions where compute operates, inviting securities, consumer-protection, or disclosure challenges.
Falsification: No enforcement actions or litigation testing the gap between accounting-based claims and local emissions profiles by end of 2029.
XVII. Conclusion
Microsoft’s Three Mile Island agreement established the template; Amazon, Google, and Meta validated the pattern; finite supply and slow institutional adaptation ensure the dynamic persists. The CDT simulation reveals that opposition activates late, correction arrives after lock-in, and the real curb on hyperscaler capacity preemption is physics plus institutions that update too slowly—not political resistance.
Prediction Recap
The simulation’s six predictions define the validation window. By 2026, queue leverage disputes surface in contested proceedings. By 2027, public controversy consolidates around rate and reliability impacts rather than greenwashing, and municipal coalitions form in response to firm clean supply constraints. By 2028, at least two additional hyperscalers complete capacity-preemptive arrangements of 300 megawatts or greater, and front-of-the-meter structures entrench as the survivable regulatory template. By 2029, the gap between portfolio-level carbon claims and local physical emissions becomes litigable. Each prediction includes explicit falsification criteria; validation or falsification will determine whether the capacity-preemption thesis holds or requires revision.
Strategic Implications
The strategic implication extends beyond energy procurement. Hyperscaler nuclear PPAs demonstrate how sophisticated actors exploit temporal asymmetries between contract execution and regulatory response. The pattern generalizes: any domain where institutional adaptation lags private contracting tempo creates preemption opportunities for actors with long time horizons, strong balance sheets, and tolerance for complexity.
Microsoft did not solve the power shortage. Microsoft solved priority under shortage—and exposed who cannot compete for it.
Document Classification: Public
Simulation Version: 1.0
Validation Window: 2026–2032
Contact: MindCast AI