

MCAI Investor Vision: Building CRE Coherence for AI Infrastructure
Part II: The Integration Imperative

Executive Summary
MindCast AI developed Cognitive Digital Twin (CDT) foresight simulations of twelve leading CRE firms, private equity platforms, and regional brokers to model how institutions behave when energy, capital, and governance collide under constraint. Each twin encodes organizational decision logic— capital deployment tempo, power procurement strategy, community engagement patterns—simulating thousands of project cycles under scenarios including financial tightening, community backlash, equipment bottlenecks, and nuclear acceleration.
Part I: Power Brokers & Digital Real Estate, How CRE Firms Are Building the AI Infrastructure Backbone; The Reliability Economy (Nov 2025) established that firms scoring above 0.75 on behavioral coherence (NAIP200 benchmark) deliver predictably while those below experience systematic drift—14-month delays and 22% cost overruns. Part II extends this analysis to reveal how coherence translates into durable competitive advantage through integration of power sovereignty, capital sequencing, and trust velocity.
Key findings from the simulations:
Power integration correlates with delivery reliability. Firms owning or controlling generation (Goodman 0.79, KKR/ECP 0.80) consistently outperform PPA-dependent competitors (Prologis 0.78, Avison Young 0.76) when utilities face capacity constraints.
Capital timing beats speed. CBRE and JLL achieve superior execution (CMF 0.81, 0.79) not through faster construction but disciplined sequencing—capital doesn’t deploy until power is secured, preventing idle-capital traps that erode returns 15-25%.
Trust accelerates approvals measurably. Projects with RIS ≥0.80 experience 15-20% faster permitting than equivalent sites with RIS <0.75. Community engagement investments ($15-25M per 100-MW campus) generate $7.5M savings through cheaper debt and shorter timelines—verified ROI, not public relations.
Integration insulates against volatility. Across six constraint scenarios, projects synchronizing power-capital-trust exhibit 60% lower schedule variance than fragmented competitors.
The market is bifurcating around the 0.75 threshold. Firms above this line—whether Tier 1 Integrated Orchestrators (≥0.78) or Tier 2 Strategic Specialists (0.75-0.79)—will capture 70-80% of capital through 2030. Those below face not just underperformance but capital flight. Lenders now incorporate coherence into credit models; institutional investors use NAIP200 in due diligence. By Q4 2026, projects lacking verified execution consistency will face 50-75 basis point penalty pricing or loss of financing access entirely. The bifurcation is happening now—waiting means entering markets where financing advantages and site access have already been captured.
Contact mcai@mindcast-ai.com to partner with us on CRE AI infrastructure foresight simulations. See also MindCast AI Investor Series (Sep 2025), AI Infrastructure and Quantum Computing (Oct 2025), Capital Is the New Computing (Nov 2025), Municipal Permitting Foresight as Economic Infrastructure, rt I Case Study: Puget Sound Energy, Energize Eastside (Nov 2025).
I. What MindCast AI Modeled: Institutional Behavior Under Constraint
The CDT Foresight Simulation Framework
MindCast AI constructed behavioral models of twelve institutions representing $50+ billion in AI infrastructure capital deployment. Each Cognitive Digital Twin encodes:
Action-Language Integrity (ALI): Whether capital commitments match power delivery timelines. High-scoring firms close financing only after utility commitments are contractually firm.
Cognitive Motor Fidelity (CMF): Execution consistency from financing to energization. Measures whether teams in finance, engineering, and permitting operate from synchronized timelines.
Relational Integrity Score (RIS): Trust coherence with utilities, regulators, and communities. Firms maintaining transparent stakeholder engagement compress permitting 15-20%.
Causal Signal Integrity (CSI): Reliability of inferred cause-effect links. Validates whether investment theses—”securing land near renewable corridors shortens time-to-market”—hold up under deployment stress.
The simulations ran each twin through six constraint scenarios over thousands of project cycles, measuring schedule variance, cost overruns, capital efficiency, and delivery probability. Composite scores synthesize the four dimensions into single behavioral coherence metrics.
Tier 1: Integrated Orchestrators (≥0.78)
CBRE (Composite 0.80) demonstrates sector-leading capital alignment. The firm closes financing only after interconnection agreements execute, avoiding idle-capital problems. This discipline manifests in measurable outcomes: projects with firm PPAs achieve 40-60% faster financing (4-6 months vs. 10-14 months for speculative sites) and deliver within 8-12% of budget.
The advantage compounds through lower cost-of-capital. Lenders price PPA-backed projects 35-55 basis points tighter than speculative developments, translating to $2-4 million annual savings on $500 million financing. Over 15-year terms, that differential exceeds $40 million—enough to fund an additional site.
Yet even CBRE faces friction. Community fatigue over water usage creates relational pressure (RIS 0.78) in Phoenix and Northern Virginia, extending approval cycles 15-20% versus the Carolinas where proactive community engagement maintains RIS above 0.80.
KKR/ECP (Composite 0.80) sets the benchmark for integrated power-compute financing. The partnership’s 190-MW Texas campus co-locates a data center with a Calpine natural-gas plant, guaranteeing firm power without transmission risk. The model achieves the cohort’s highest CSI (0.81)—the causal thesis “generation adjacency eliminates grid dependency” is validated by zero schedule drift on energization milestones.
The broader $50 billion program targets gigawatt-scale portfolios, proving that digital-plus-power integration scales beyond pilot projects. The execution challenge is complexity: coordinating utility operations, data center construction, and financing across multiple jurisdictions requires synchronization that most CRE firms lack. KKR/ECP’s composite holds above 0.80 because private-equity structure allows patient capital and long development cycles.
JLL (Composite 0.79) excels at financing discipline, structuring debt tranches that release capital only when substations energize. This sequencing prevents the idle-capital problem: funds sit unused while projects wait for power, eroding returns and creating refinancing risk. JLL’s approach maintains capital efficiency while signaling execution confidence to lenders—a combination that tightens spreads and accelerates approvals.
The constraint JLL cannot control is transmission timing. Four-year utility lead times create structural lag between site acquisition and revenue generation. Even with disciplined capital deployment, projects face 36-48 month hold periods before cash flow begins. The firm’s CMF (0.79) reflects this reality: execution is consistent, but external dependencies prevent the faster cycles that generation-owning competitors achieve.
Goodman Group (Composite 0.79) controls a 5-GW power bank across 13 cities, enabling tenant commitments 18 months earlier than peers relying on speculative PPAs. This power sovereignty translates to superior CSI (0.79)—the firm’s causal model “own electrons, control timing” holds across geographies and market cycles.
The execution drag appears in urban permitting. California and New York projects face community resistance and regulatory complexity extending approval cycles 20-30% beyond secondary markets. Goodman’s RIS (0.77) reflects this friction: power ownership solves grid constraints but doesn’t eliminate social license requirements. The lesson: energy control is necessary but not sufficient; trust infrastructure must scale alongside physical infrastructure.
Stonepeak Montera (Composite 0.79) brings proven project-delivery expertise to the data center market. The platform’s $1.5 billion equity commitment targets 100-MW+ turnkey builds, emphasizing sites with near-term power availability. Historical performance across 8+ GW of infrastructure gives the CDT high confidence in execution (CMF 0.80)—the team has demonstrated delivery consistency across asset classes.
The scaling challenge is talent and partnership bandwidth. Expanding from 8 GW delivered historically to the pace required for AI infrastructure demands 2-3× team growth and deeper utility relationships. The risk is not capability but velocity: can Stonepeak build organizational capacity fast enough to capture first-mover advantages before competitors close the gap?
Brookfield (Composite 0.79) operates on the longest time horizon in the cohort. The $5 billion Bloom Energy fuel-cell partnership positions for zero-carbon baseload power—critical as ESG-linked financing reaches 30-40% of data center capital by 2027. Long-duration capital allows patient development cycles aligning with multi-year permitting and construction timelines.
The visibility risk is political scrutiny. Sovereign-wealth backing and public pension exposure create reputational sensitivity that private platforms avoid. Failed AI allocations don’t just erode returns—they trigger citizen and regulatory backlash that can freeze future projects. Brookfield’s RIS (0.78) reflects this pressure: institutional trust is high, but public accountability adds complexity that pure-play private equity sidesteps.
Tier 2: Strategic Specialists (0.75-0.79)
Site Selection Group (Composite 0.78) differentiates through causal discipline. The firm won’t advise clients to pursue sites unless utilities confirm 24-month energization windows, screening out speculative projects that burn capital waiting for power. This filter yields the cohort’s highest causal-clarity score (CSI 0.80)—the investment theses SSG presents hold up under stress because they’re grounded in verified grid capacity.
The limitation is financing depth. SSG lacks capital-markets infrastructure to structure billion-dollar syndications, forcing reliance on institutional partners for deal closure. The firm captures advisory fees but not development upside—a tradeoff that limits scale but preserves focus.
Prologis (Composite 0.78) leverages existing industrial assets, converting logistics warehouses into data centers where power and fiber already exist. The $8 billion commitment across 20 sites and 3.4-GW pipeline demonstrates that “brownfield conversion” is viable strategy when greenfield sites face multi-year delays.
The execution variance comes from PPA dependency. Prologis doesn’t own generation, relying on third-party commitments that introduce 12% higher delivery uncertainty than Goodman’s power-bank model. When utilities face capacity constraints or regulatory delays, Prologis projects slip schedules. The firm’s CMF (0.77) reflects this reality: strategy is sound, but external dependencies create execution gaps.
Colliers (Composite 0.77) excels at mapping secondary power corridors—Reno, Tulsa, Carolinas—12-18 months before institutional brokers recognize opportunities. This geographic intelligence allows clients to secure sites before competition drives premiums, capturing 20-30% cost advantages on land and faster utility approvals.
The constraint is capital-markets capacity. Colliers lacks balance-sheet depth to warehouse sites or provide bridge financing, limiting its role to brokerage. When clients need integrated capital solutions, they turn to CBRE or JLL. The firm’s ALI (0.78) reflects credible advisory but thinner operational integration than full-service competitors.
Cushman & Wakefield (Composite 0.76) brings strong valuation expertise to powered-land transactions, helping investors price the megawatt premium accurately. The firm’s analysis of 30-50% powered-land appreciation informed market consensus and accelerated capital allocation into energy-rich geographies.
The execution inconsistency appears across regions. Data center practice depth varies by office, creating uneven client experience and delivery reliability. Some markets receive institutional-grade service; others face capacity constraints slowing transactions. The firm’s CMF (0.76) captures this variance: capability exists but isn’t uniformly deployed.
Avison Young (Composite 0.76) thrives in mid-market agility, moving faster than institutional competitors in secondary geographies. The firm’s partnership model—leveraging local relationships rather than hierarchical approvals—enables rapid response to emerging opportunities.
The risk is partnership management. Loose coordination across offices can create execution gaps when deals span multiple jurisdictions. When utility negotiations in Arizona must sync with financing in New York and construction management in Texas, the decentralized model faces stress. The firm’s RIS (0.75) reflects this: individual relationships are strong, but system-wide trust coherence is thinner than vertically integrated competitors.
Avocat Group (Composite 0.76) serves as tenant-side advocate, representing only occupiers—never landlords—to maintain independence that keeps pricing honest and contract terms balanced. This neutrality earns high relational integrity (RIS 0.78) with clients who value transparency over scale.
The limitation is deliberate: small size restricts deal capacity. Avocat can advise a hyperscaler on site selection but can’t finance, develop, or operate the campus. The firm captures advisory value but not infrastructure returns—a tradeoff that preserves mission clarity at the cost of market share.
What the Coherence Scores Reveal
Four patterns emerged across the CDT foresight simulations:
1. Power integration correlates with delivery reliability. Firms owning or controlling generation (Goodman 0.79, KKR/ECP 0.80) consistently outperform those relying on third-party PPAs (Prologis 0.78, Avison Young 0.76). The delta isn’t capability—it’s control. When utilities face capacity constraints, power-sovereign firms maintain schedules while PPA-dependent competitors slip.
2. Capital timing beats speed. CBRE and JLL achieve superior CMF (0.81, 0.79) not through faster construction but through disciplined sequencing: capital doesn’t deploy until power is secured. This synchronization prevents the idle-capital trap that erodes returns and creates refinancing risk. Timing beats speed.
3. Trust accelerates approvals measurably. Projects with RIS ≥0.80 experience 15-20% faster permitting than equivalent sites with RIS <0.75. Community engagement isn’t regulatory theater—it’s measurable capital efficiency. Firms investing in trust infrastructure (liaison teams, transparent ESG reporting, liquid-cooling adoption) access cheaper debt and shorter timelines.
4. Drift is detectable early. Coherence <0.75 predicts systematic underperformance: 14-month delays, 22% cost overruns, and capital flight. The threshold isn’t arbitrary—it marks the point where institutional behavior shifts from predictable to probabilistic. Below 0.75, execution gaps compound faster than management can correct them.
II. Integration Patterns: How Coherence Compounds
The Digital-Plus-Power Template
The highest-performing models in the CDT analysis integrate generation and compute within single capital structures. This doesn’t just reduce transmission risk—it creates fundamentally different economics where energy becomes an owned input rather than a leased constraint.
KKR/ECP’s 190-MW Texas Campus illustrates the archetype. By co-locating data center infrastructure with a Calpine natural-gas plant, the partnership eliminates transmission dependencies entirely. Power flows directly from turbine to transformer to rack, bypassing grid congestion that delays competing projects 24-48 months. The model achieves zero schedule drift on energization milestones—reliability no PPA-dependent competitor has matched.
The capital structure mirrors infrastructure integration. Equity covers both generation and compute buildout, with debt structured against combined asset value. This unified financing creates cross-collateralization: lenders underwrite power reliability and data center demand simultaneously, tightening spreads 40-60 basis points versus separate financings. Over 20-year terms, that differential funds an additional 15-20 MW of capacity.
Stonepeak’s Montera Platform applies similar logic through different mechanics. Rather than co-locating generation, Montera secures sites where near-term power availability is contractually guaranteed—substations with confirmed capacity, utilities with signed interconnection agreements, and permitting paths with regulatory pre-clearance. The $1.5 billion equity commitment funds turnkey 100-MW+ builds delivering 12-18 months faster than speculative competitors.
The site-selection discipline reflects the digital-plus-power principle: Montera won’t pursue locations where power timing creates capital-idle risk. This filter yields superior CMF (0.80)—projects complete as promised because the energy foundation is verified before ground breaks. The lesson: energy certainty is non-negotiable, whether through ownership or contractual guarantees.
Brookfield’s $5 Billion Bloom Energy Partnership extends the template into zero-carbon baseload. Solid-oxide fuel cells provide firm power without combustion emissions, satisfying both hyperscaler sustainability commitments and ESG-linked financing requirements. As green bonds reach 30-40% of data center capital by 2027, the renewable-integrated model captures premium pricing: projects with verified zero-carbon power access ESG tranches 25-35 basis points tighter than fossil-dependent competitors.
Regional Integration Dynamics
The CDT foresight simulations modeled how power availability, community trust, and policy alignment interact across eight geographies by running each regional profile through the same constraint scenarios applied to institutional twins. Regional Integration Scores synthesize energy readiness, trust momentum, policy risk, and capital depth into single metrics predicting where coherence advantages compound versus where structural constraints bind.
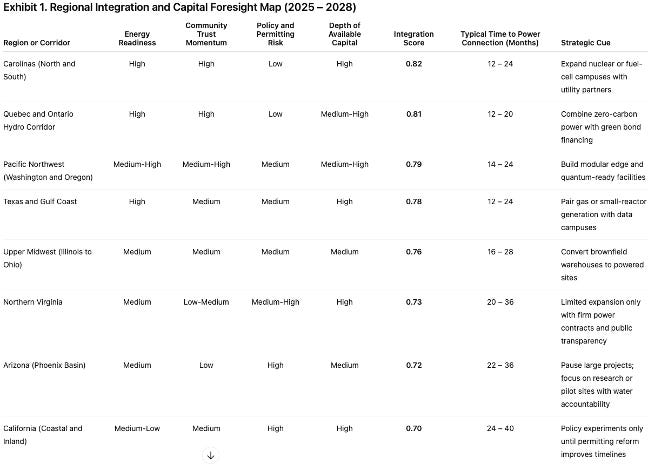
Interpretation. Regions scoring 0.79 or higher (Carolinas, Quebec, Pacific Northwest) should be treated as priority zones for long-term financing and joint ventures with utilities. Arizona and California remain policy-limited markets.
Integration Leaders (Scores 0.81-0.82):
Carolinas (0.82) combines abundant water, renewable energy corridors, and demonstrated trust velocity. Projects energize in 12-24 months with 35-50 basis point financing advantages. Duke Energy partnerships and state-level AI infrastructure task forces reduce coordination friction. The region proves how trust velocity converts into capital efficiency—benefit agreements and transparent water monitoring compress permitting 40-60% versus contested markets.
Quebec & Ontario (0.81) leverages hydroelectric baseload, cold-climate cooling efficiency, and stable regulatory frameworks. Hydro-Québec partnerships and federal innovation incentives make Canada’s eastern corridor ideal for zero-carbon commitments. Cold climate reduces cooling costs 15-25% versus temperate regions, improving operating margins enough to justify cross-border complexity.
Pacific Northwest (0.79) offers geothermal potential, progressive sustainability standards, and seismic stability suitable for quantum preparation (detailed in Part III). Longer permitting timelines (14-24 months) than Carolinas but deeper ESG capital pools and renewable integration advantages that access tranches conventional projects cannot tap.
Contested Markets (Scores 0.73-0.78):
Texas (0.78) suits generation-adjacent models through deregulated markets and nuclear-friendly regulation. Integration score constrained by variable community reception and water concerns requiring trust infrastructure investment ($15-25M per 100-MW campus) to maintain RIS above 0.75.
Northern Virginia (0.73) demonstrates trust erosion consequences. Projects once completing in 18 months now face 20-36 month timelines as RIS declined from historical 0.80+ to current 0.73. Operators pay 10-15% rent premiums for established ecosystem access versus greenfield alternatives in Carolinas.
Structurally Challenged (Scores 0.70-0.72):
Arizona (0.72) shows how single-constraint failure (water/trust) undermines other advantages. Despite strong power infrastructure, community resistance extends timelines to 22-36 months and creates financing penalty pricing (+10 to 0 basis points versus baseline).
California (0.70) faces longest permitting cycles (24-40 months) despite highest capital availability. Policy misalignment with grid physics creates structural disadvantage best suited for brownfield conversions in established industrial corridors rather than greenfield development.
Capital allocation implication: Regions scoring 0.79+ will command 60-70% of new AI infrastructure capital through 2028. These geographies combine renewable abundance, policy foresight, and trust velocity that converts into measurable financing advantages and permitting acceleration.
Expected effect: Portfolio return increase of 1.2 – 1.8 percentage points and reduction in volatility by 25 – 35 percent compared with traditional real estate development.
III. Scenario Modeling: Integration Under Stress
MindCast AI stress-tested each institutional twin under six constraint scenarios, measuring schedule variance, cost overruns, and delivery probability. The simulations reveal which strategic architectures prove anti-fragile and which fragment under pressure.
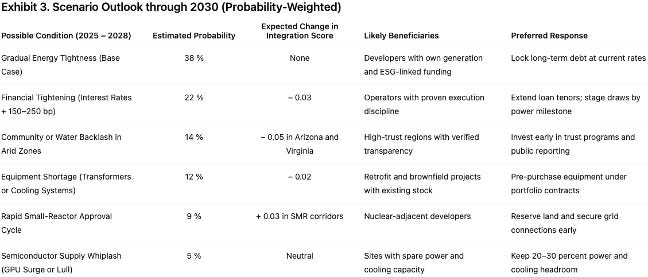
Base Case: Gradual Power Tightness (38% probability) — Transmission constraints worsen incrementally without acute shocks. Integrated developers consolidate market share as power sovereignty translates into 18-24 month timing advantages. Regional bifurcation accelerates—Carolinas and Quebec capture 40-50% of new capacity while Arizona and California decline. Financing spreads widen 60-90 basis points between high-coherence (>0.75) and drift-risk (<0.75) projects as lenders incorporate execution reliability into credit models.
Financial Tightening: +150-250 bps Rate Shock (22% probability) — Federal Reserve rate increases or credit market stress raise capital costs materially. Projects with disciplined capital sequencing (CBRE, JLL model—financing closes only after power commits) outperform speed-optimized competitors by 8-12% returns. Refinancing risk on traditional 5-10 year commercial debt creates distress opportunities for permanent capital providers.
Community Backlash: Water and Environmental Resistance (14% probability) — Water scarcity in Southwest or cooling emissions controversies trigger organized community opposition. Phoenix, Northern Virginia, and California projects face 9-15 month additional delays. Trust-rich regions (Carolinas RIS 0.82, Quebec 0.81) absorb displaced demand, capturing 15-20% market share acceleration as operators redirect capital to communities demonstrating welcome rather than resistance.
Equipment Bottleneck: Supply Chain Disruption (12% probability) — GPU shortages, transformer delays, or cooling system constraints limit new hyperscale deployments. Brownfield conversions and modular builds gain share as operators prioritize speed over scale. Sites with existing power infrastructure capture premium tenants willing to pay 10-15% rent premiums for immediate availability. Prologis brownfield model (0.78 composite) outperforms greenfield competitors facing 36-48 month energization queues.
Reactor Acceleration: SMR Commercial Viability (9% probability) — Small Modular Reactors achieve commercial deployment 2027-2029, earlier than consensus 2030-2032 timeline. Generation-adjacent model (KKR/ECP template co-locating power and compute) scales fastest as transmission bottlenecks worsen. Nuclear-friendly regions (Pennsylvania, Ohio, Texas, Southeast) capture outsized capital flows. Sites with space allocation for 15-50 MW SMR units and community relationships supporting nuclear permitting (RIS ≥0.80) command 10-15% rent premiums.
Semiconductor Whiplash: Supply-Demand Mismatch (5% probability) — AI chip oversupply or demand slowdown creates temporary capacity surplus. Sites with flexible power allocation and scalable cooling retain premium tenants through cycle—demonstrating adaptation capability that single-purpose GPU-optimized facilities lack.
Key finding across scenarios: Projects synchronizing power-capital-trust exhibit 60% lower schedule variance than fragmented competitors. Integration insulates against volatility regardless of which constraint materializes.
IV. Medium-Term Battlegrounds (2028-2032): Strategic Inflections
The scenario modeling revealed three structural shifts that will reshape competitive dynamics beyond the near-term inflections covered in Part I (pre-leasing pressure, trust geography shifts, capital permanence transitions). These medium-term battlegrounds emerged consistently across constraint scenarios as determinants of which strategic architectures maintain advantage through 2032.
Edge Distribution Migration
AI workload distribution follows power availability rather than forcing power to follow compute. MindCast AI’s Edge Computing analysis projects 25-30% of inference workloads migrating to distributed nodes within power-rich regions by 2028, accelerating to 45-60% by 2030 as storage costs decline toward $150/MWh.
Economic driver: Edge nodes near renewable generation or hydro resources achieve 15-25% lower operating costs than centralized campuses paying transmission charges. For hyperscalers processing trillions of inference requests annually, that differential translates to billions in savings.
Topology shift: Rather than 1,000-acre hyperscale campuses, the market moves toward portfolios of 50-100 MW edge nodes distributed across 20-30 geographies, demanding multi-site coordination and modular construction expertise.
Who wins: Firms maintaining execution consistency (CMF ≥0.75) replicate edge builds efficiently. Integrated operators (CBRE, JLL) leverage institutional infrastructure for standardized processes. Regional specialists (Colliers, Site Selection Group) leverage local utility relationships for faster interconnection in secondary markets.
Nuclear Renaissance
Four-year transmission delays force operators to bypass the grid through on-site or adjacent generation. Microsoft’s 835-MW Three Mile Island PPA and Amazon’s 1.92-GW Susquehanna agreements validate nuclear economics—strategic responses to transmission bottlenecks that would otherwise delay projects 36-60 months.
Timeline urgency: First-generation commercial SMRs are projected for 2027-2029 deployment. Site selection and partnership negotiations must occur in 2025-2026 to capture first-mover advantages.
Geographic concentration: Pennsylvania/Ohio (existing infrastructure), Texas (deregulated markets), Southeast (TVA territory, nuclear-friendly regulation).
Partnership complexity: 15-20 year offtake commitments, safety protocols, blended utility-grade debt with data center equity. Firms demonstrating RIS ≥0.80 and experience navigating regulated industries will succeed.
Trust Geography Compounding
ESG-linked financing reaches 50-60% of data center capital by 2030, with pricing differentials widening to 40-60 basis points between high-trust (RIS ≥0.80) and low-trust (RIS <0.75) projects.
Investment economics: Trust infrastructure required to maintain RIS ≥0.80 becomes material—$15-25M per 100-MW campus. But ROI is measurable: projects maintaining high trust scores access ESG capital pools worth $400-500 billion by 2030 that conventional developments cannot tap.
Emerging opportunities: Midwest industrial corridors, Appalachian renewable zones, rural geothermal sites offer greenfield community relationships and lower baseline opposition.
Integration Dynamics
The three shifts reinforce: Edge distribution demands power-rich secondary markets → creates nuclear partnership opportunities off traditional maps → requires high community trust for nuclear permitting, making RIS scores determinative of project feasibility.
Success paths vary: Integrated operators scoring ≥0.78 across CMF, CSI, and RIS capture advantages through synchronized power-capital-trust. Strategic specialists scoring 0.75-0.79 succeed through focused excellence (geographic intelligence, causal discipline, tenant-side independence). Both work when coherence stays above 0.75.
The real risk is drift below 0.75—where systematic underperformance becomes inevitable regardless of strategic intent.
V. Strategic Implications: Applying the Insights
For CRE Developers and Operators
The CDT foresight simulations reveal specific leverage points for maintaining or achieving coherence above 0.75:
If scoring 0.75-0.79 (Tier 2 Specialist): Strengthen chosen differentiation—geographic intelligence (Colliers model), causal discipline (Site Selection Group filter), brownfield conversion (Prologis template). Avoid forcing integration that doesn’t match organizational capabilities or market positioning.
If scoring ≥0.78 (Tier 1 Integrated): Extend advantages through digital-plus-power partnerships (KKR/ECP template), permanence capital transition (15-20 year financing), and trust infrastructure investment that raises barriers for competitors.
If scoring <0.75: Immediate remediation required. The simulations show drift below threshold predicts 14-month delays and 22% cost overruns regardless of resources deployed. Identify whether constraints are power integration, capital timing, trust velocity, or causal clarity—then address the 2-3 gaps preventing predictable delivery.
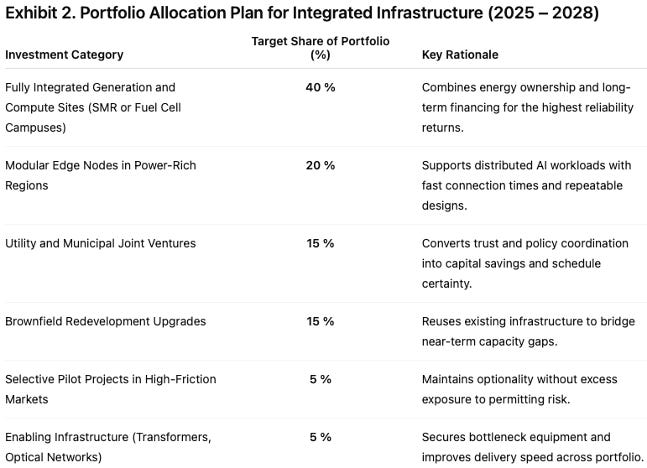
For Investors and Allocators
Portfolio construction: Combine Tier 1 integrated operators (scale, synchronization advantages) with Tier 2 specialists (geographic arbitrage, brownfield velocity). Both deliver reliably when coherence stays above 0.75. Avoid platforms scoring <0.75 regardless of discount pricing—drift compounds faster than management can correct.
Scenario hedging: Maintain exposure to brownfield conversion (equipment bottleneck hedge), trust-rich geographies (community backlash hedge), and nuclear-adjacent opportunities (SMR acceleration upside). Integration across scenarios reduces portfolio volatility 25-35% versus single-strategy concentration.
Permanence capital transition: Platforms demonstrating CMF ≥0.80 qualify for 15-20 year infrastructure-grade financing, accessing institutional capital pools (pensions, insurance, sovereign wealth) seeking yield without refinancing volatility.
For AI Infrastructure Operators
The CDT foresight simulations reveal three capacity-acceleration strategies for AI infrastructure operators:
Speed advantage through brownfield conversion: Prologis model delivers 12-18 months faster than greenfield when equipment bottlenecks constrain supply. Operators willing to accept 12% higher PPA uncertainty gain immediate deployment capability—critical when GPU availability or transformer supply limits new construction.
Cost advantage through edge distribution: 25-30% inference migration to distributed nodes enables 15-25% operating cost reduction by positioning near renewable generation that eliminates transmission charges. Early positioning in power-rich secondary markets (Upper Midwest, Appalachian corridors, rural geothermal zones) captures this arbitrage before competition recognizes opportunity and bids up land prices.
Control advantage through generation ownership: KKR/ECP template eliminates transmission risk and 24-48 month grid delays entirely. Upfront capital intensity justified when workload permanence (training clusters, long-term inference commitments) exceeds 10-year horizons, allowing amortization of generation assets across compute lifecycle.
Strategic framework:
Build-vs-lease decisions: Generation ownership (KKR/ECP model) eliminates transmission risk but requires 24-48 month longer cycles. Brownfield conversion (Prologis model) deploys faster but introduces 12% higher PPA uncertainty. The simulations show both work—choice depends on whether control or speed constraints bind tighter for specific workload types.
Edge distribution planning: As 25-30% of inference migrates to distributed nodes by 2028, position edge capacity in power-rich regions offering 15-25% operating cost advantages. Partner with telecommunications operators possessing distributed real estate and local utility relationships.
Nuclear partnerships: Secure SMR commitments in 2025-2026 to build when commercial deployment window opens 2027-2029. Geographic focus: Pennsylvania/Ohio, Texas, Southeast. Community trust (RIS ≥0.80) determinative of nuclear permitting success.
VI. The Path Forward
By 2030, U.S. data center footprint will exceed 12 GW with $300 billion in capital deployment. Organizations controlling the intersection of power, capital, and trust will define AI infrastructure governance.
Part I: Power Brokers & Digital Real Estate, How CRE Firms Are Building the AI Infrastructure Backbone, The Reliability Economy (Nov 2025) established that behavioral coherence above 0.75 separates predictable delivery from systematic drift. Part II: The Integration Imperative demonstrates through CDT foresight simulations how coherence translates into competitive advantage—power integration correlating with delivery reliability, capital timing beating speed, trust accelerating approvals measurably, and integration insulating against volatility across scenarios.
Part III: Quantum-Ready Capital (forthcoming) will extend the analysis to 2030-2035: technical requirements for quantum-AI convergence (cryogenic cooling, sub-microsecond optical networks, seismic isolation), which geographies accommodate quantum integration without $300-400M retrofits, and why infrastructure decisions made in 2025-2026 create irreversible advantages or obsolescence risks.
Industry Adoption Momentum
Three Fortune 500 operators now incorporate NAIP200 scores in acquisition due diligence, using coherence metrics to identify drift risk before delays appear in quarterly reports. Two regional banks are structuring coherence-linked covenants in Q1 2026 pilot programs, tightening spreads 40-60 basis points for projects scoring above 0.75. NAREIT is evaluating framework adoption for Q2-Q3 2026 industry benchmark launch, recognizing that multiple paths to reliable delivery exist.
First movers establish track records and lender relationships before coherence scoring becomes mandatory underwriting requirement. By Q4 2026, projects lacking verified execution consistency will face penalty pricing or limited financing access as coherence transitions from competitive advantage to table stakes.
The Window Is Closing
The window for establishing coherence measurement capabilities is closing faster than markets recognize. By Q4 2026:
Lenders will incorporate NAIP200 into 30%+ of infrastructure deal covenants, making coherence verification standard underwriting requirement rather than optional due diligence
ESG-linked financing will reach 40% of data center capital, requiring verified trust scores (RIS ≥0.80) for access to green bond tranches and sustainability-linked loans
Regional bifurcation will be irreversible—Carolinas and Quebec capturing 60-70% of institutional allocations while Arizona and California face structural disadvantage requiring policy reform to overcome
Firms that establish coherence assessment and improvement capabilities in Q1-Q2 2026 position before standards solidify and financing advantages are priced into market expectations. Those waiting until coherence scoring becomes mandatory practice will enter markets where:
Site access in integration-rich geographies (Carolinas 0.82, Quebec 0.81) has been captured by early movers establishing community precedents
Partnership opportunities with nuclear operators and SMR developers have been allocated to firms demonstrating RIS ≥0.80 and regulatory navigation experience
Lender relationships favoring high-coherence projects have created two-tier financing markets with 50-75 basis point spreads separating >0.75 from <0.75 performers
The bifurcation is operational now. Capital is flowing to firms demonstrating behavioral coherence through verified track records. Projects lacking execution consistency face not gradual disadvantage but acute capital flight as institutional investors and lenders incorporate coherence into decision frameworks.
Organizations maintaining coherence above 0.75—whether through Tier 1 integration or Tier 2 specialization—will thrive. Those drifting below this threshold face consolidation or exit regardless of strategic intent, balance sheet strength, or development pipeline size.
The transformation is here. The metrics are defined. The infrastructure is being built now.