

MCAI Investor Vision: Power Brokers & Digital Real Estate, How CRE Firms Are Building the AI Infrastructure Backbone
Part I: The Reliability Economy

See also Part II Building CRE Coherence for AI Infrastructure, The Integration Imperative (Nov 2025).
Executive Summary
Artificial Intelligence has inverted commercial real estate economics. Energy now dictates value—measured in megawatts secured, months to energization, and community trust earned. Commercial Real Estate (CRE) firms recognizing this shift early will capture the $300 billion AI infrastructure build-out through 2030. Those that don’t will watch capital flow to competitors who mastered the new game.
MindCast AI modeled twelve leading CRE firms using Cognitive Digital Twin (CDT) simulations—data-driven models predicting institutional behavior under energy scarcity, capital pressure, and regulatory friction. Firms scoring ≥0.78 on behavioral coherence (our NAIP200 benchmark) deliver projects on schedule and below budget. Those scoring <0.75 experience 14-month delays and 22% cost overruns on average.
The winners share three traits: They synchronize financing with power delivery, not land acquisition. They own or control generation, not just lease space. They maintain community relationships that compress permitting 15-20%.
Contact mcai@mindcast-ai.com to partner with us on CRE AI infrastructure foresight simulations. See MindCast AI Investor Series (Sep 2025), Capital Is the New Computing (Nov 2025), AI Infrastructure and Quantum Computing (Oct 2025).
I. The Great Inversion
In 2025, a data center in rural North Carolina commands higher lease rates than premium Manhattan office space. AI has rewritten the grammar of real estate economics. For over a century, property value rose from proximity—where roads met ports, where skyline views met labor pools. Value now flows from electrons. Modern developers count megawatts before measuring frontage. A site’s worth depends on grid interconnection queue position and the credibility of power commitments.
Northern Virginia once anchored global data center development. Today, despite more than four gigawatts of active capacity, vacancy sits below 2%. In the Carolinas, land values along new transmission corridors have tripled in three years because utility commitments arrive in under eighteen months. Phoenix faces doubled lead times from water constraints and permitting friction, pushing developers east into New Mexico and west into Texas. Every geography tells the same story: energy has become destiny.
Table 1. The Power Economics Shift (2020-2025)
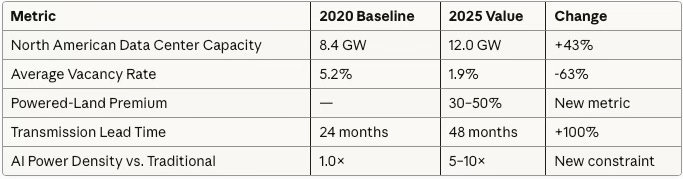
The old equation—land, labor, logistics—has inverted. The new formula reads: power, permitting, trust. Firms mastering these three variables capture velocity. Those ignoring them become tenants of others’ foresight.
II. When Power Replaced Property
The inversion began quietly around 2021 when hyperscalers started signing long-term power purchase agreements before finalizing campus locations. By 2025, lenders followed suit. No project now reaches financial close without proof of firm power. The order of operations has reversed: secure the electrons first, then the acreage, then the tenants.
AI workloads draw five to ten times more power per rack than conventional cloud servers. Hyperscalers must secure substation proximity years in advance. JLL’s 2025 Outlook warns that power transmission approvals now average four years—longer than construction cycles themselves. Where CRE once negotiated leases, firms now structure power purchase agreements, green bonds, and tax-equity syndications. The skillset has shifted from real estate finance to infrastructure finance. The peer group has expanded from landlords and tenants to utilities, regulators, and community stakeholders.
Table 2. AI Campus Development Requirements
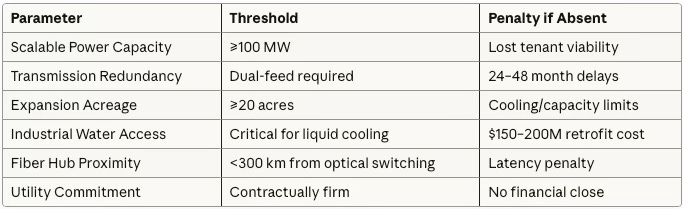
Three physical realities drive the inversion:
Transmission delays connecting new campuses to high-voltage lines require utility upgrades taking 24-48 months after permitting—which itself requires 12-24 months. JLL’s four-year average is optimistic. Contested projects in California and Virginia stretch beyond five years.
Cooling intensity from AI chips generating 5-10× more heat than traditional servers demands liquid immersion cooling—now standard for new GPU clusters. Sites lacking water infrastructure face environmental permitting obstacles, community acceptance battles, and retrofit costs exceeding $200 million.
Network latency requirements for training clusters demand sub-millisecond interconnect across thousands of nodes. Only sites within 300 km of fiber hubs and optical switching stations support distributed AI workloads. Geography no longer means proximity to users but proximity to photons.
Firms pre-positioning in powered geographies—securing PPAs, cooling permits, and fiber access before competitors recognize opportunities—achieve 18-24 month time advantages. Early movers lock utility capacity, set community precedent, and establish regulatory relationships raising barriers for followers. Real estate has become energy arbitrage. The question shifts from “where should we build?” to “where can electrons, cooling, and capital converge fastest?”
III. Modeling Institutional Behavior
Which firms will deliver under pressure? MindCast AI modeled twelve leading CRE and private equity platforms through Cognitive Digital Twins (CDTs)—behavioral simulations measuring how institutions perform under constraint. Each digital twin maps organizational reflexes: when capital commits, how utility negotiations sequence, whether public commitments survive stress. The system measures reliability, not reputation.
NAIP200 coherence matters economically because it proxies investor confidence. High behavioral scores signal consistent alignment between intent and execution, reassuring lenders that capital will convert into operational capacity rather than stranded equity. In the ESG era, consistency translates into compliance credibility—projects led by coherent firms satisfy sustainability covenants and disclosure standards with fewer audit risks. Institutional investors now interpret strong NAIP200 scores the way they once read credit ratings: as proof that management quality and moral reliability price into yield.
Table 3. Behavioral Coherence Metrics (NAIP200)
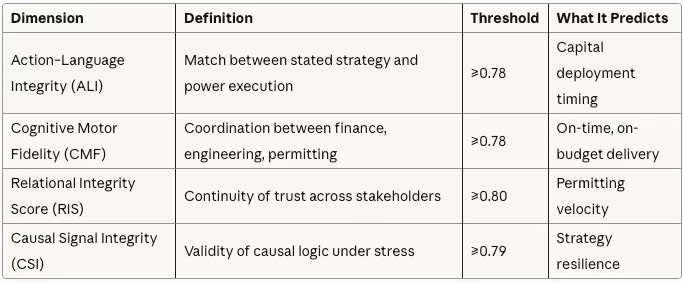
Across thousands of simulated project cycles, one pattern emerged: coherence above 0.78 produces predictable outcomes—on-time delivery within budget. Below 0.75, drift accelerates. Delays average fourteen months and costs rise twenty-two percent. The conclusion is behavioral but economic: discipline functions as yield. Lenders and equity partners have begun incorporating coherence scores into credit models, pricing reliability as an asset class.
IV. Anatomy of Advantage
When mapped against actual performance, coherence distribution divides the market into distinct tiers. The gap between them is not just operational—it’s structural. High-coherence firms have fundamentally different reflexes around capital timing, power control, and stakeholder management.
Table 4. Market Bifurcation by Coherence
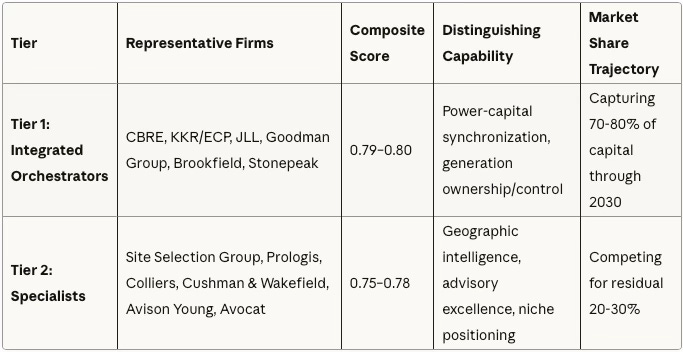
Tier 1: Integrated Orchestrators
CBRE (0.80) sequences financing only after interconnection agreements execute, saving millions in interest by avoiding idle capital. Projects with firm PPAs achieve 40-60% faster financing (4-6 months vs. 10-14 months for speculative sites) and deliver within 8-12% of budget. The advantage compounds through lower cost of capital. Lenders price PPA-backed projects 35-55 basis points tighter than speculative developments, translating to $2-4 million annual savings on $500 million financing. Over fifteen years, the differential exceeds $40 million—enough to fund an additional site.
KKR/ECP (0.80) sets the benchmark for integrated power-compute financing. The partnership’s 190-MW Texas campus co-locates a data center with a Calpine natural gas plant, guaranteeing firm power without transmission risk. The model achieves the cohort’s highest CSI (0.81)—the causal thesis “generation adjacency eliminates grid dependency” validates through zero schedule drift on energization milestones. The broader $50 billion program targets gigawatt-scale portfolios, proving digital-plus-power integration scales beyond pilot projects.
Goodman Group (0.79) controls a 5-GW power bank across 13 cities, enabling tenant commitments 18 months earlier than peers relying on speculative PPAs. Power sovereignty translates to superior CSI (0.79)—the firm’s causal model “own electrons, control timing” holds across geographies and market cycles. The execution drag appears in urban permitting. California and New York projects face community resistance extending approval cycles 20-30% beyond secondary markets.
Brookfield (0.79) operates on the longest time horizon in the cohort. The $5 billion Bloom Energy fuel cell partnership positions for zero-carbon baseload power—critical as ESG-linked financing reaches 30-40% of data center capital by 2027. Long-duration capital allows patient development cycles aligning with multi-year permitting and construction timelines.
Tier 2: Specialists
Site Selection Group (0.78) differentiates through causal discipline. The firm won’t advise clients to pursue sites unless utilities confirm 24-month energization windows, screening out speculative projects burning capital waiting for power. The limitation is financing depth. SSG lacks capital-markets infrastructure to structure billion-dollar syndications, forcing reliance on institutional partners for deal closure.
Prologis (0.78) leverages existing industrial assets, converting logistics warehouses into data centers where power and fiber already exist. The $8 billion commitment across 20 sites and 3.4-GW pipeline demonstrates “brownfield conversion” viability when greenfield sites face multi-year delays. Execution variance comes from PPA dependency—Prologis doesn’t own generation, relying on third-party commitments introducing 12% higher delivery uncertainty.
Colliers (0.77) excels at mapping secondary power corridors—Reno, Tulsa, Carolinas—12-18 months before institutional brokers recognize opportunities. Geographic intelligence allows clients to secure sites before competition drives premiums, capturing 20-30% cost advantages. The constraint is capital-markets capacity. Colliers lacks balance-sheet depth to warehouse sites or provide bridge financing.
What the Scores Reveal
Power integration correlates with delivery reliability. Firms owning or controlling generation (Goodman 0.79, KKR/ECP 0.80) consistently outperform those relying on third-party PPAs (Prologis 0.78, Avison Young 0.76). The delta isn’t capability—it’s control. When utilities face capacity constraints, power-sovereign firms maintain schedules while PPA-dependent competitors slip.
Capital timing is the hidden variable. CBRE and JLL achieve superior CMF (0.81, 0.79) not through faster construction but through disciplined sequencing: capital doesn’t deploy until power is secured. Synchronization prevents the idle-capital trap eroding returns and creating refinancing risk. Timing beats speed.
Trust accelerates approvals. Projects with RIS ≥0.80 experience 15-20% faster permitting than equivalent sites with RIS <0.75. Community engagement isn’t regulatory theater—it’s measurable capital efficiency. Firms investing in trust infrastructure access cheaper debt and shorter timelines.
V. The Governance Era
High-coherence firms now operate as hybrid institutions—part developer, part utility, part civic intermediary. Financing gets treated as engineering. Community engagement functions as underwriting. Equity funds site control only after utilities sign. Debt activates as construction begins. ESG bonds price once water-cooling systems verify. Discipline cutting carrying costs up to twenty-five percent raises IRR by double digits. Markets reward restraint that looks like foresight.
Table 5. Trust Infrastructure ROI
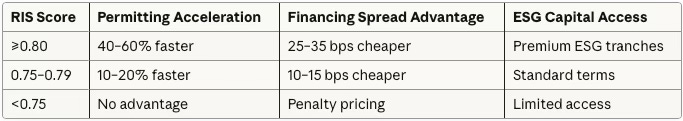
Annual value on $500M project with RIS ≥0.80: $1.5–2.5M in financing savings, 6–9 months faster to revenue
The transformation reaches beyond profit. CRE has become an instrument of public governance. Developers mediate between data demand, grid constraint, and environmental legitimacy. In Phoenix, community backlash over water use extended permit timelines nine months. In the Carolinas, proactive transparency halved them. Every jurisdiction learns that moral coherence shortens economic distance.
Governance requires new organizational capabilities. Developers establish community affairs divisions staffed by former utility regulators and municipal planners. Financial structures incorporate trust metrics into covenant triggers—projects falling below RIS 0.75 face equity redemption clauses. Site selection committees include environmental scientists and sociologists alongside engineers and accountants.
The skillset dividing Tier 1 from Tier 2 is no longer purely financial—it’s institutional: the ability to operate as a regulated entity without being regulated. Firms hiring for 2025 projects seek candidates with joint degrees in law and environmental science, or utility operations and municipal finance. Org charts flatten—community liaisons report directly to CFOs because trust velocity impacts capital access.
Policy frameworks are evolving to match operational reality. States including Virginia and North Carolina launched interagency task forces linking energy regulators, economic development boards, and housing authorities to coordinate site approvals. Texas and Arizona tie data center incentives to renewable integration benchmarks through permitting reforms. Treasury guidance under the Green Infrastructure Bond program encourages coherence metric disclosure as ESG compliance. Municipalities once resisting large campuses now view transparency metrics as tools attracting permanent capital. Regulatory foresight is maturing—policy catches up to the physics of power.
VI. The Next 24 Months
Three inflection points will separate leaders from followers between now and Q2 2027. Each creates measurable advantages for firms anticipating and adapting early. Capital is already repositioning—the question is whether your firm leads or follows the migration.
Pre-Leasing Crunch (Q4 2025 – Q2 2026): Power scarcity forces structural financing changes. CDT projections show 40-50% of new developments requiring firm utility commitments before capital close by mid-2026, reversing traditional sequence where financing preceded infrastructure coordination. Projects with secured PPAs achieve 40-60% faster financing. Lenders now underwrite energization timing as rigorously as tenant creditworthiness. Regional brokers capturing 8-12% market share by mapping secondary power corridors—Reno, Tulsa, Carolinas—where sub-100 MW tranches energize within 6-12 months.
Trust Geography Shift (Q3 2026 – Q2 2027): ESG-linked financing transitions from niche to mainstream. CDT projections show green bonds and sustainability-linked loans reaching 30-40% of new data center capital by Q4 2026. Projects with RIS ≥0.80 command 25-35 basis-point pricing advantages. Phoenix and Northern Virginia face 6-9 month permitting delays as communities push back on water consumption. Operators shift 15-20% of planned capacity to trust-rich geographies: Carolinas (abundant water, renewable energy), Quebec (hydroelectric baseload, cold climate), Pacific Northwest (geothermal potential, progressive standards).
Capital Permanence (Q3 2027 – Q2 2028): Long-duration financing (15-20 year terms) becomes standard for hyperscale campuses as markets recognize AI infrastructure’s multi-decade asset life. Firms scoring CMF ≥0.80 access permanence capital 50-70% faster than competitors with execution uncertainty. The shift solves refinancing risk—traditional 5-10 year commercial debt creates rollover exposure during market stress. Permanence capital locks in cost of capital for asset life, attracting institutional investors seeking yield without refinancing volatility.
The phases interact and compound. Pre-leasing pressure creates demand for powered sites, driving operators toward trust-rich geographies where permitting accelerates delivery. Faster delivery builds execution track records unlocking permanence capital, which funds the next generation of integrated energy-compute campuses. Firms navigating all three phases maintain momentum. Competitors stumbling in any phase fall behind exponentially.
The strategic window closes by Q2 2028. Market structure will set: Tier 1 operators (≥0.80 composite) will control 70-80% of capital flow, Tier 2 specialists (0.75-0.79) will serve niche markets, and sub-0.75 firms will have exited or consolidated.
VII. The Path Forward
Reliability has become the new global currency of development. In an era where capital, energy, and social legitimacy converge, the ability to deliver on promise outweighs speculative speed. Every data point in this analysis—schedule drift, permitting delay, financing spread—translates into a moral and economic truth: coherence pays. Investors reward coherence with lower cost of capital. Communities reward it with trust. Markets now trade not only in land and electrons, but in credibility.
The stakes reach beyond profit. As grids tighten and AI workloads multiply, reliability becomes the stabilizing force between innovation and equity. Each coherent project is a miniature covenant between capital and society, ensuring progress remains anchored in foresight. Coherence data convert ethics into efficiency, and efficiency back into trust.
What Comes Next
High coherence scores tell us who will win—but not how they’re building institutional infrastructure to sustain advantage. Part II—Integrating Power, Capital & Trust—documents the mechanisms taking shape now: tri-party agreements where CRE, utilities, and hyperscalers share equity; ESG bond covenants pricing RIS scores directly; community benefit corporations converting trust into development rights. These aren’t theoretical—they’re being finalized in Q4 2025 and will define competitive structure through 2030.
Beyond 2030, permanence capital itself evolves. Part III—Quantum-Ready Capital—maps how infrastructure decisions made in the next 18 months create irreversible advantages: which geographies possess seismic stability quantum computing requires; how permanence financing prices 20-year optionality; why firms treating 2025 site selection as 2035 positioning will capture returns everyone else will chase. Quantum computing’s arrival by 2030-2032 will impose new physical laws—cryogenic cooling, sub-microsecond optical networks, vibration isolation. Sites selected today must accommodate tomorrow’s requirements or face $300-400M retrofit costs. The quantum preparation window closes faster than markets recognize.
The Inflection
By 2030, U.S. data center footprint will exceed 12 GW with $300 billion in capital deployment. Firms controlling the intersection of power, capital, and trust will define AI infrastructure governance. Those that don’t will service the grid rather than shape it.
The infrastructure is being built now. The question is whether your firm is building it—or will be leasing from those who did.