

Related works: State AG Coalitions in the Landscape of Emerging Federalism | How Antitrust Clearances, Preemption Claims, and Acceleration Orders Produce State AG Enforcement Networks
Executive Summary
Thirty-eight states signed the Kalshi appellate amicus at roughly the cost of formatting a brief. Eight states carried the RealPage antitrust complaint at the cost of years of staff time. The core insight is stated flat: coalition size measures the price of joining, not the strength of conviction, and reading headcounts as consensus misprices every multistate matter in America.
The thesis. Coalition size is the clearing quantity of an enforcement market. Lead states absorb the fixed costs of theory and evidence; a credible cross-party bridge certifies that the theory travels; and each remaining office joins when its reservation price falls below the payoff.
Federal action sets the payoff: withdrawal raises the value of substitution, an exclusivity claim manufactures simultaneous injury across fifty sovereigns, and allocation disclosure pulls the late-joinder wave.
Which networks form, how large they grow and whether they sustain commitment are therefore predictable. Vehicle and stage carry more predictive weight than party alone, and so do portability, remedy compatibility and bridge entry.
What distinguishes the MindCast approach. Doctrinal commentary counts signatures. MindCast models the market that produces them: game theory supplies the payoff structure of joining and defection; behavioral economics supplies the salience and imitation effects that move late joiners; and the MindCast AI Proprietary Cognitive Digital Twin Foresight Simulation (MP CDT FS) converts the combination into falsifiable Simulation Predictions.
The September 4 run released the coalition-route portfolio of eight primary and four secondary Simulation Predictions in Section VIII, each carrying a band, a falsifier and a graded checkpoint schedule.
What the paper does and how it proceeds. Section I frames coalition formation as a dynamic market and states the paper’s position downstream of Installment I. Section II defines the breadth-alignment-commitment vector. Section III maps the operating core and the three membership clusters.
Section IV supplies the joining economics and predictors. Section V verifies the model against eleven trajectories. Section VI pairs Kalshi and Live Nation as the model’s hardest tests.
Section VII sets the dataset and settlement cadence. Section VIII carries the Simulation Predictions with stakeholder risk mitigation. Section IX concludes with the predictive mechanism and its stakeholder implications.
MindCast Simulation Prediction highlights. The September 4 register prices the coalition route in eight primary and four secondary Simulation Predictions; the strongest entries follow, and Section VIII carries the full slate with falsifiers and checkpoints.
Partisan challenges to the incumbent administration clear within two of the opposition ceiling (84–93%).
Every coalition above twenty-five members runs on an operating core of eight or fewer offices (80–90%).
A major multistate matter shows a late-joinder wave after recovery allocation goes public (76–88%).
Large breadth arrives only with pre-filing cross-party entry (66–78%).
Bridge-state entry accelerates joinder within the following sixty days (62–76%).
Stakeholders.
🏛️ Policymakers should legislate against coalition vectors rather than headcounts. A 40-signature letter and an 8-state complaint signal opposite things about commitment, and statutes drafted to the wrong signal inherit the enforcement gap.
💼 Executives should price the stage, not the roster. The dangerous moments are bridge entry and allocation disclosure, because each drops every remaining state’s reservation price at once.
⚖️ Counsel should negotiate against the operating core while validating authority to bind the roster. Eight or fewer offices do most of the work in coalitions of twenty-five plus. The core’s reservation price rather than the caption sets the settlement range.
📊 Investors should trade the commitment axis rather than the breadth axis. Coalition announcements reprice on signatures; outcomes follow evidence portability and remedy compatibility.
I. Coalition Formation as a Dynamic Market
Coalition size is not a direct measure of legal conviction. Size records the state of a propagation process: lead states produce the legal and factual infrastructure, bridge states certify that the theory travels, and additional states join as uncertainty and marginal participation cost fall.
Lead states absorb the fixed costs of theory development. Absorption drops the joining price toward formatting cost, and the coalition clears at whatever quantity the price regime supports. Coalition size is therefore the clearing quantity of an enforcement market, and the paper’s differentiating finding follows: reading the quantity correctly requires separating what a coalition counts from what it commits.
Installment I established that federal permission propagates rather than settles authority, and that temporary state networks function as a distributed national regulator. Installment II supplies the formation mechanics: which networks form, how large they become, and whether they sustain meaningful action.
Takeaway. Treat every coalition announcement as a market print rather than a poll result, and the rest of the model follows.
II. Three Measures Define Every Coalition
Reading a coalition takes three measures: how many offices joined, which offices joined, and how much each office committed. The paper calls the three together the coalition vector: breadth, alignment and commitment.
Breadth counts jurisdictions. A seed coalition runs two to eight states and a medium coalition runs nine to twenty-four; a large coalition runs twenty-five to forty and a near-universal coalition runs forty-one or more.
Alignment describes the political mix: partisan, bipartisan, regional or subject-specific. Commitment measures what members actually spend, from a signature on a letter through coordinated positions and funded litigation to trial and remedy work.
The record anchors the scale. RealPage ran eight states in bipartisan funded litigation, and the funding-freeze challenge ran twenty-three partisan states in litigation.
The Kalshi amicus ran thirty-eight bipartisan states at signature level, and Equifax reached fifty jurisdictions in a bipartisan settlement. Shorthand joins the three scores with hyphens, so Live Nation after the Department of Justice (DOJ) settlement reads large-bipartisan-trial: the rare coalition holding breadth and maximum commitment at once.
One label cannot do the work of three. An eight-state complaint is small by headcount and maximal by commitment, and a 38-state amicus is large by headcount and minimal by commitment. Prediction therefore targets all three measures together.
Takeaway. Breadth, alignment and commitment move independently, and reading any one alone misprices the coalition.
III. The Operating Core and Membership Clusters
The most stable element across matters is not a fixed roster but a small group of high-capacity offices. New York has historically led multistate actions at roughly twice the rate of the next-most-active state.
California, Washington and Colorado recur most often. Massachusetts, Connecticut, New Jersey and Illinois follow. Maryland, North Carolina, Ohio and Pennsylvania recur beside Texas and Tennessee; importance varies by subject.
As of August 2026 reporting dates, California, Colorado and Washington each reported participation in more than seventy challenges to the current administration. The totals establish activity rather than leadership, and the network analysis codes lead, co-lead and signatory roles separately. The raw counts move month to month.
Around the core, three membership clusters form. The party-network cluster governs suits against the federal administration: membership sorts by party, and the practical ceiling is the opposition-party roster rather than fifty states. A 22-signatory common-interest agreement pre-committed the current bloc before the administration took office.
The subject-matter cluster activates different offices by domain because expertise, statutes, and exposure differ. A state peripheral in federal-policy litigation can be central in a gaming matter.
The bridge-state cluster supplies the cross-party participants large bipartisan coalitions require. A credible cross-party participant reduces the political cost of joinder and increases the probability of coalition expansion.
The mechanism is behavioral before it is legal: the bridge functions as a Schelling focal point that makes entry safe to coordinate on; late joinder runs on imitation as salience rises and price falls; and defection prices settlement acceptance in loss-framed political terms. Tennessee performed the role in RealPage and in Live Nation co-leadership, and the 60-day checkpoint tests whether bridge entry increases the subsequent joinder rate.
The academic evidence supports the cluster separation. Corporate-enforcement litigation runs more bipartisan than litigation against the federal government, and in consumer cases an attorney general’s own party was not always a significant predictor across a study of 172 multistate matters; infraction severity and expected settlement value were. Supreme Court state-brief data from 1979 through 2013 found express state-versus-state disagreement in roughly six percent of cases, and regional diversity raised the probability that an amicus coalition obtained its preferred result more than ideological mix did.
Takeaway. The stable object is the core plus the cluster logic, never a fixed fifty-state roster.
IV. Joining Economics and Predictors
Joining is an economic decision, and the factors that move it are enumerable. The table below lists the drivers the record supports, each stated with its expected effect on coalition size.
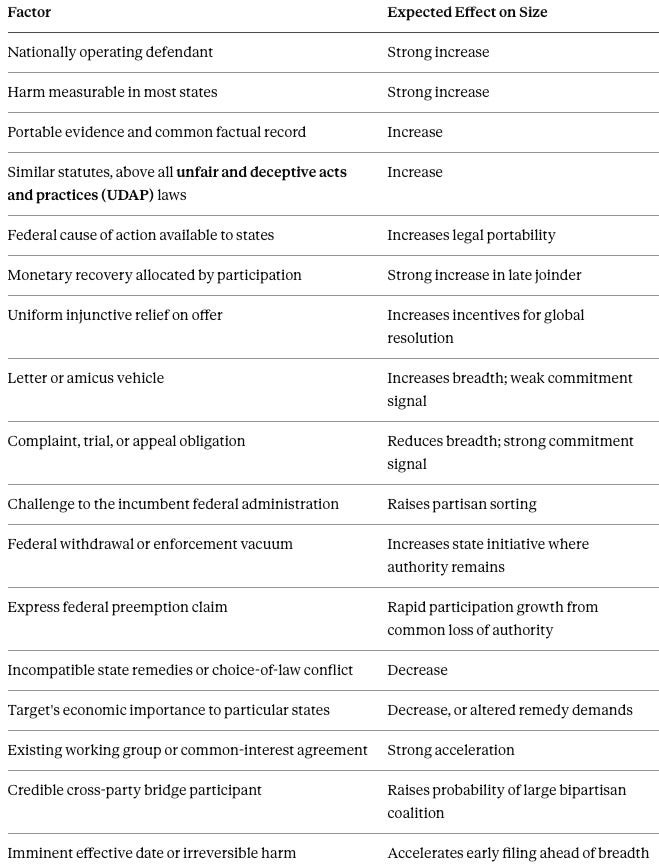
State-level joining is modelable as a logit over eight variables: exposure; statutory authority and standing; prior collaboration with the lead states; partisan compatibility; remedy compatibility; salience to constituents; expected staff and discovery cost; and local dependence on the defendant or affected industry. A time-dependent cascade term rises with existing membership, bridge credibility, and irreversible events such as filing or federal withdrawal.
The specification stands as the model’s estimation strategy. The Simulation Predictions in Section VIII stand on the run record now; the dataset grades and refines them rather than preceding them.
Prediction Rules by Breadth Band
A seed coalition of two to eight is most likely when few states hold clean standing, venue selection matters, and speed outweighs signaling. The four-state birthright citizenship filing and the six-state student-loan challenge that prevailed at the Supreme Court fit the profile.
A medium coalition of nine to twenty-four is most likely when the issue is politically polarized and membership approaches the opposition-party ceiling. The 23-attorney-general funding-freeze challenge sits at the ceiling of the available opposite-party universe with sufficient fiscal injury.
A large coalition of twenty-five to forty is most likely when the defendant and harm are national, the theory is portable, and at least one cross-party bridge exists. The vehicle is typically a letter, an amicus, or a mature complaint whose development costs have already been absorbed.
A near-universal coalition of forty-one-plus jurisdictions generally requires an ideologically low-conflict harm with direct injury in nearly every jurisdiction. Standardized or divisible recovery, low marginal joining cost, and the absence of local economic reasons to defend the target complete the profile.
Takeaway. Joining economics predicts breadth; ideology predicts alignment; the run measured both rather than selecting one.
V. Trajectories the Record Verifies
Eleven completed or advanced matters test the model against the record. Each row states the coalition’s development and the vector it expressed, and the moving counts across stage transitions carry the lesson.
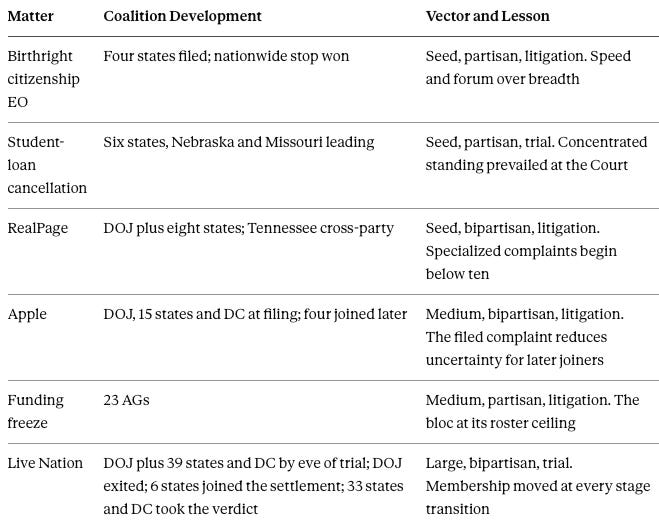
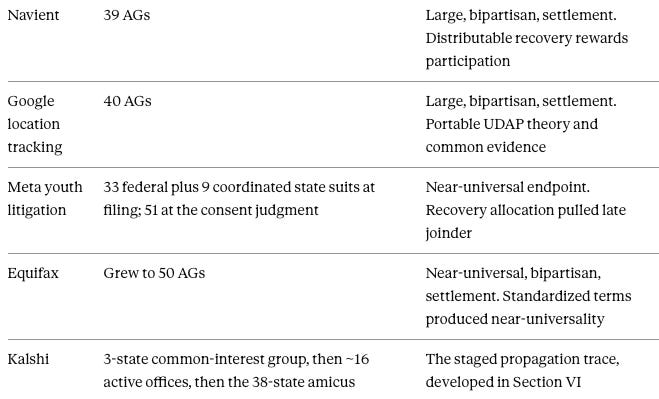
The Live Nation moving count is the propagation claim in miniature. Participation, exit and defection each mark a stage transition; continuation and verdict complete the sequence, each with a different clearing quantity.
Kalshi is the model’s canonical staged specimen: technical coordination preceded regulatory alignment, and regulatory alignment preceded low-cost public joinder. Section VI develops the trace in full.
Takeaway. Membership moves at stage transitions, and the moving counts are the evidence.
VI. Paired Case Studies: Kalshi and Live Nation
The pairing tests the model’s two hardest claims together. Kalshi tests whether propagation is observable in stages rather than inferred from endpoints. Live Nation tests whether breadth and maximum commitment can coexist and what sustains them when they do.
Kalshi: Expansion Through Lower-Cost Participation
The claimed sequence runs in three stages. A small common-interest group of three states first built a shared understanding of the federal-state boundary; regulatory alignment then spread to roughly sixteen active offices; and the 38-state amicus finally expressed the matured consensus through the least expensive vehicle available.
Public filings verify the large-coalition endpoints: 36-plus in the Fourth Circuit, 38 in the Massachusetts filing and 39 in Assad. The earlier three-state and sixteen-office stages remain provisional and do not govern the released Simulation Predictions.
The trace matters because each stage shows a different price regime clearing. Technical coordination cost real staff time and cleared at three. Regulatory alignment cost position-taking and cleared near sixteen.
Public joinder cost formatting and cleared at thirty-eight, and the exclusivity claim accelerated every transition because it made all fifty sovereigns perceive the same institutional injury at the same moment.
Commitment stayed concentrated while breadth expanded. Individual enforcement remained with a handful of offices (Washington, Nevada, New York and New Jersey carried the merits litigation) while the amicus wall supplied representative breadth at signal-level commitment. The vector reads large-bipartisan-signal at the appellate layer over seed-bipartisan-litigation at the merits layer, and collapsing the two layers into one headcount would misstate both.
Live Nation: Commitment Surviving Federal Exit
The standardized milestones run participation and exit, then defection and continuation, then verdict. The DOJ plus 39 states and the District prosecuted to the eve of trial; the DOJ exited by settlement after one week; six Republican-led states joined the federal settlement; 33 states and the District continued in the same courtroom; the continuing coalition won full liability on April 15.
Each transition marks a different clearing quantity under a different price. Joining the original action cost little once the DOJ carried the record.
Continuing after federal exit cost trial-team commitment, and the coalition that cleared at that price held both portable evidence and compatible remedies, exactly the conjunction the commitment condition predicts. The six-state defection priced partisan settlement acceptance, anchoring the defection-recurrence Simulation Prediction’s range.
The two cases bound the model’s space. Kalshi shows the least expensive vehicle producing the widest coalition; Live Nation shows the most expensive vehicle producing the most consequential one.
Every other trajectory in Section V sits between them. The model’s claim is that vehicle cost and portability, with remedy compatibility and bridge certification, locate each matter on that spectrum in advance.
Takeaway. The paired cases verify the model at its extremes: propagation observable in stages, and commitment sustained only where evidence travels and remedies align.
VII. Dataset and Estimation
Each state-action pair is one observation. Membership is recorded at five stages: initial investigation or common-interest group; public letter or comment; original complaint; amended complaint or intervention or amicus; and settlement through trial and appeal.
The source spine combines the National Association of Attorneys General (NAAG) multistate settlements and antitrust databases with the State Litigation and AG Activity Database, official complaints and individual attorney general releases. Normalization is required because reported counts mix states, territories, and regulators and change across the case life.
Role coding separates lead and co-lead from operational participant and bridge, and both from late joiner and defector. Network analysis identifies repeat leaders and subject communities. Event-history analysis tests whether filing or bridge entry changes the joinder rate, and likewise recovery allocation, federal withdrawal and exclusivity claims.
Settlement occurs against observable events rather than narrative impressions. The tracker captures federal trigger and lead state and first bridge; vehicle and filing stage and participant count; operating core and evidence portability and remedy compatibility; and exits and allocation disclosure and controlling judicial events.

Takeaway. The dataset grades the published Simulation Predictions and sharpens later runs, and the checkpoint cadence converts them into a graded record.
VIII. Simulation Predictions and Stakeholder Risk Mitigation
The MP CDT FS run of September 4, 2026 released the portfolio below. The register prints eight primary and four secondary entries in numeral order under the P and S convention: P for Primary Simulation Prediction, S for Secondary Simulation Prediction.
Checkpoints run at 30, 60 and 90 days, 12 months and 24 months. Settlement occurs against observable events rather than narrative impressions; the Section VII tracker enumerates the captured fields.
Primary Simulation Predictions
P-1. Conditional coalition vector. 66–78%. The next national consumer-protection or platform matter reaches large breadth of 25 to 40 jurisdictions conditional on a cross-party entrant before the complaint stage, and clears at medium breadth without one. Falsifier: large breadth with zero pre-filing cross-party participation. Exposure: one to two filing cycles lost at medium breadth plus forgone shared discovery scope. Mitigation: coalition directors prepare neutral harm language and a minimum common remedy before approaching a bridge state; lead division chiefs define contribution tiers at seed; defense counsel maps likely entrants within ten days of any bridge entry. Residual: symbolic bridges that certify nothing.
P-2. Bridge acceleration. 62–76%. In eligible matters the first credible cross-party bridge increases the joinder rate in the following 60 days relative to the preceding 60, controlling for filing and allocation events. Falsifier: post-bridge joinder fails to exceed pre-bridge joinder across the eligible sample. Exposure: the post-bridge window compresses containment options for defendants. Mitigation: lead counsel starts the 60-day recruitment clock at bridge entry and assigns outreach by relationship network; coalition managers log entrant dates for the pre-post test; defense General Counsel decides on compatible relief by day 30. Residual: cascade attribution where filing or allocation explains the wave.
P-3. Operating core. 80–90%. Coalitions exceeding 25 public members retain an operating core of eight or fewer offices performing most theory, discovery, trial and remedy work. Falsifier: a qualifying coalition distributes most operational work across more than eight offices. Exposure: concentrated staff-months across eight or fewer offices and settlement delay if any core office exits. Mitigation: operations leads allocate core workstreams with backup ownership before discovery opens; the lead attorney general reviews contribution and exit risk every 30 days; settlement leads separate operational votes from public membership before term sheets. Residual: expertise and turnover preserving concentration.
P-4. Partisan ceiling. 84–93%. State challenges to the incumbent federal administration clear within two members of the opposition-party attorney-general ceiling and rarely become large bipartisan litigation coalitions. Falsifier: a majority of qualifying challenges sit more than two below the ceiling, or two or more become large bipartisan coalitions. Exposure: added filing-cycle cost without added discovery scope or evidentiary breadth. Mitigation: coalition leads choose the cleanest plaintiff and injury and forum over the largest caption; agency general counsel stress-tests standing and severability in likely lead states before rollout. Residual: aligned filing incentives.
P-5. Commitment condition. 74–84%. Every coalition of 25-plus sustaining trial-stage commitment exhibits both portable evidence and compatible remedies. Falsifier: a large coalition sustains trial coordination on divergent proof or remedies. Exposure: months of settlement delay and duplicated discovery scope where proof or remedies diverge. Mitigation: lead division chiefs define the common harm and portable evidence and minimum remedy at coalition seed; settlement leads record minimum acceptable relief before the first offer; coalition managers run a remedy-divergence exercise before term sheets. Residual: reservation-price drift after sunk costs rise.
P-6. Vehicle breadth gap. 74–86%. Median breadth of public letters and amicus briefs exceeds median breadth of original multistate complaints by ten or more jurisdictions. Falsifier: an observed median difference below ten. Exposure: signature breadth overstates the offices prepared to fund litigation. Mitigation: working-group chairs label the vehicle and required commitment level at publication; litigation leads reconfirm which signatories will supply evidence and staff before escalation; defense government-affairs leads classify participants by vehicle and role within a week. Residual: nonpublic coordination making a nominal signatory consequential.
P-7. Allocation wave. 76–88%. At least one major multistate matter shows a measurable late-joinder wave after monetary recovery allocation becomes public. Falsifier: no qualifying matter shows a distinct post-disclosure joinder increase. Exposure: late entry enlarges outlay and prolongs release mechanics after a deal appears complete. Mitigation: settlement leads set eligibility and late-entry rules before allocation publication; coalition managers monitor joinder for 60 days after disclosure; Chief Financial Officers reserve for the full eligible pool at announcement. Residual: political override of entry rules.
P-8. Defection recurrence. 55–68%. A same-party defection bloc of four to ten states recurs at the next contested federal settlement. The defection pool is the coalition’s administration-aligned wing, settlement pressure splits that wing between political alignment and remedy stake, and Live Nation anchors the distribution at six. Falsifier: no same-party defection bloc occurs, or the bloc falls outside four to ten. Exposure: a defection bloc hardens public expectations against the continuing coalition. Mitigation: coalition managers run an exit and remedy-divergence exercise before the first offer; lead attorneys general separate common terms from state-specific addenda before announcement; defense counsel tests which parties can deliver finality before term sheets. Residual: turnover-driven reservation prices.
Secondary Simulation Predictions
S-1. Lead-state selection. 62–75%. New York or California or Washington or Colorado leads or co-leads a majority of new 25-plus corporate-enforcement coalitions; the role-coding caveat is explicit. Exposure: early compulsory process from a repeat-leader state foreshadowing national formation. Mitigation: defense General Counsel checks working-group ties within 72 hours of compulsory process from a repeat-leader state; government affairs briefs the board on repeat-leader exposure within the same week. Residual: a new subject shifting leadership to an unexpected office.
S-2. Roster mutation. 78–88%. November 2026 shifts the partisan-bloc ceiling by one to three offices. Exposure: pending-challenge breadth repricing within one filing cycle of certified results. Mitigation: agency policy leads re-map likely lead states within 30 days of certified results; coalition leads re-sequence pending filings before new offices are sworn in. Residual: runoffs and recounts extending uncertainty.
S-3. Forum migration. 52–66%. The Section 230 procedural-character question generates a certiorari petition within twelve months. Exposure: discovery timing across pending platform matters turning on the split’s resolution path. Mitigation: platform appellate leads align preservation strategy across forums before dispositive motions; product counsel maintains state-specific compliance pending resolution. Residual: denial leaving the split standing.
S-4. Authorization-price movement. 70–80%. Median disclosed concession terms rise through two consecutive quarters. Exposure: site-comparison models aging one quarter behind disclosed terms. Mitigation: development chiefs re-price site comparisons each quarter against disclosed terms; Chief Financial Officers update reserve requirements on the same cadence. Residual: nondisclosed concessions skewing the observable median.
Stakeholder summary. 🏛️ Policymakers legislate against coalition vectors rather than headcounts. 💼 Executives price global resolution against the allocation wave and the settlement-exposure finding. ⚖️ Counsel negotiate against the operating core while validating authority to bind the roster. 📊 Investors trade the commitment axis rather than the breadth axis.
Takeaway. The coalition route converts formation mechanics into dated, falsifiable claims, and the checkpoint schedule grades every band in public.
IX. Conclusion: The Predictive Mechanism
The mechanism compresses to one sentence. Federal action sets the payoff to joining; lead-state investment sets the fixed costs; vehicle choice sets the marginal price; bridge certification and allocation disclosure move the reservation prices. The coalition clears at the quantity those forces support, with breadth and alignment and commitment each moving on its own axis.
The mechanism converts observation into anticipation. A matter’s likely vector is readable before the caption fills: an exclusivity claim forecasts fast broad signal coalitions, while a structureless federal settlement forecasts state continuation by the committed core. Allocation disclosure forecasts the late wave, and the absence of a bridge forecasts a ceiling at medium breadth.
For stakeholders the implications run through every prediction in Section VIII. Policymakers legislate against vectors; executives price stages; counsel negotiate against the core; investors trade commitment. The distributed national regulator operates through measurable coalition-formation rules, and its formation is now a modeled, predicted and graded process.
Takeaway. Coalition formation has become forecastable infrastructure, and the register will prove or falsify that claim on a published schedule.
Appendix. Sources and Corpus
The corpus below assembles the MindCast publications underlying this paper’s argument, followed by the academic and data sources behind the estimation program. Each entry carries a hyperlinked title where published and a statement of its role.
A. Series and Framework
Why Federal Permission No Longer Ends Regulatory Contests (Installment I, 2026). Establishes the propagation principle and the distributed national regulator this paper’s formation mechanics complete.
A New Era of Federalism. The series foundation for competitive federalism as market infrastructure.
State AGs and Federal Inaction. Documents the substitution modality the coalition model prices.
MindCast Foresight Prediction Simulations, Synthesizing Behavioral Economics + Game Theory. The synthesis architecture this paper applies: game theory supplying payoff structure, behavioral economics supplying focal points and imitation and loss framing, and the transition function forecasting formation across rule changes.
B. Case-Study Records
The National Kalshi Litigation Map. Supplies the boundary-enforcement record and the capture taxonomy referenced in the case studies.
The Kalshi Circuit Split. Carries the Assad record behind the 39-state amicus endpoint in the Section VI trace.
The Kalshi Vehicle Contest. Documents the September 2 petition behind the forum-migration secondary in Section VIII.
Section 230 After the Meta Settlement. Carries the interpretive-fragmentation record the forum-migration secondary grades against.
Meta Settlement Validation Scorecard. Documents the 51-jurisdiction consent judgment behind the Meta trajectory row and the allocation-wave claim.
C. Cross-Domain Validations
Chicago School Accelerated Part III: Posner. Carries the 42-state AI hallucination intervention validating large-coalition formation on a low-conflict harm.
The Crypto ATM Regulatory Convergence. Validates the formation mechanics in consumer-protection networks outside the flagship domains.
The DOJ Isn’t Attacking Football, It’s Attacking Market Architecture. Grounds the seed-coalition geometry where venue and theory control outweigh breadth.
D. Academic and Data Sources
National Association of Attorneys General, Multistate Settlements Database and Antitrust Litigation Database. Primary coalition-count sources for the trajectory table.
Paul Nolette, State Litigation and AG Activity Database, attorneysgeneral.org, with Federalism on Trial: State Attorneys General and National Policymaking in Contemporary America (University Press of Kansas, 2015). The state-by-action network source for the estimation program and the lead-rate claims.
Colin Provost, “The Politics of Consumer Protection: Explaining State Attorney General Participation in Multi-State Lawsuits,” Political Research Quarterly (2006). Source for the participation model behind the severity and settlement-value findings across 172 multistate matters.
Margaret H. Lemos and Kevin M. Quinn, “Litigating State Interests: Attorneys General as Amici,” New York University Law Review 90 (2015). Source for the disagreement-rate and post-2000 partisanship findings across state Supreme Court briefs from 1979 through 2013; the regional-diversity result derives from successor amicus-coalition scholarship.
Official dockets, attorney general releases, FERC eLibrary and enacted session laws. Settlement sources for grading, as specified per prediction.
Working With MindCast
MindCast runs two service lines on one method: federalism foresight intelligence assesses where authority moves after a federal act and what the surviving state instruments cost the permission holder; coalition-formation intelligence maps which network assembles against a matter and how fast it grows.
💼 Executives facing federal resolution commission a fifty-one-jurisdiction durability assessment before signing: unreleased state claims, reserve assumptions and disclosure sequencing. The register places post-resolution state action at 73–83% and the clearance-to-multistate framing shift at 68–80%. Data-center developers commission an authorization-adjusted schedule review before final investment decision, against the twelve-state instrument diffusion at 72–84% and rising concession terms at 70–80%.
⚖️ Defense counsel commission a coalition-vector exposure map within days of first compulsory process: the operating core, what the caption overstates and what the full eligible pool costs. The register places the eight-or-fewer operating core at 80–90% and the post-allocation joinder wave at 76–88%. State attorney general offices commission a formation-design package at coalition seed, against pre-filing cross-party entry driving large breadth at 66–78% and bridge-driven joinder acceleration at 62–76%.
🏛️ Federal agency teams commission a pre-announcement state-response map: preserved state authorities, the coalition the action recruits and the savings-clause choices that dampen it. The register places faster growth after an exclusivity claim at 68–79% and partisan challenges clearing within two of the opposition ceiling at 84–93%. State legislative staff commission a template-diffusion review each session against the same twelve-state band.
📊 Investors and lenders commission a permission-durability repricing screen: federal clearance and state durability priced as separate events, and the commitment axis traded rather than the breadth axis. The register places review in the flagship vehicle contest at 58–70% and a state-built record becoming material in national review at 70–83%.
Every engagement runs on the same methodology with dated falsifiable outputs. Contact mcai@mindcast-ai.com.