

MCAI Lex Vision: Compass's Coasean Coordination Problem Part II, the Litigation–Acquisition Monopolization Strategy
A Foresight Simulation of Coordination Architecture Shock, Merger Scenario Probabilities, and National MLS Fragmentation Risk (2025–2030)

MindCast AI Compass’s Coasean Coordination Problem series is part of our Chicago School Accelerated Part I: Coase and Why Transaction Costs ≠ Coordination Costs (December 2025) framework, with sub-series:
Part I How Private Exclusives Reshape Competition and Threaten MLS Stability
Part III Coordination Costs, MLS Governance and the Compass Litigation
Part IV Platform Routing, Portal Power, and the Zillow Litigation
I. Executive Summary
The Compass–Anywhere merger threatens coordination architecture, not competition in the conventional sense.
Traditional antitrust asks whether a merger reduces competition. The Compass–Anywhere merger poses a different question: whether it destabilizes the institutional architecture that enables competition to function. The analysis is part of the MindCast AI series, Compass’s Coasean Coordination Problem:
Part I diagnosed the disease: Private Exclusives erode focal-point visibility. Compass’s Coasean Coordination Problem Part I, How Private Exclusives Reshape Competition and Threaten MLS Stability (December 2025).
Part II (what you’re reading now) models the epidemic: what happens when that disease acquires national scale through merger.
Part III (forthcoming December 2025) addresses the first prong of the litigation-acquisition monopolization strategy: what NWMLS’s Reply brief did well, the eight critical gaps that limit its persuasive force, and how coordination-cost economics transforms the case from defensive posture to offensive reframe—giving courts the vocabulary to see mandatory submission as market-enabling infrastructure, not horizontal restraint.
Part IV (December 2025) will complete the litigation analysis by examining Compass v. Zillow—the second prong, through which Compass seeks to force portals to distribute Private Exclusives and legitimize the alternative visibility channels necessary for coordination capture at national scale.
The Compass-Anywhere merger coordination-cost mechanism: Scale × Drift × Opacity × Agent Amplification = Coordination Cost Explosion. The merger multiplies these factors—it does not add them.
Key Findings
Compass exhibits the lowest Causal Signal Integrity (CSI: 0.23) among all actors in the MindCast AI foresight simulation—severe structural contradiction between stated positions and observed behavior.
NWMLS serves as the primary coordination anchor with highest integrity scores: Causal Signal Integrity (CSI: 1.80), Institutional Coherence Score (ICS: 0.94).
The merged Compass-Anywhere entity combines Compass’s high-drift architecture with national reach, enabling opacity-routing at unprecedented scale.
Coordination collapse risk rises from 48% to 62% under unconditional clearance.
Predictions
If unconditionally cleared: Private Exclusive share exceeds 10% in top 20 metros by Q4 2027. MLS listing delays exceed 48 hours in 5+ major markets. National coordination architecture fragments into regional systems by 2030.
If blocked: Compass pursues alternative opacity strategies through portal partnerships. Coordination collapse risk stabilizes at 35%. MLS focal-point integrity preserved in majority of markets.
If conditionally cleared: Compass announces and reverses transparency commitments within 12-month cycles. Integration stress produces agent attrition >15% in legacy Anywhere brands. Outcome depends on remedy enforcement intensity.
Critical window: Q1 2026 through Q2 2027. Regulatory action during this period shapes architecture; action afterward becomes remedial. Failure to intervene by Q3 2027 increases collapse probability from 48% toward 55%+.
Scenario Probabilities
Scenario A (30%): Unconditional clearance → 62% collapse risk
Scenario B (20%): Block → 35% collapse risk
Scenario C (40%, modal): Conditional clearance → 45–50% collapse risk
Scenario D (10%): Strategic reversal → 30% collapse risk
Document Roadmap
Section II (Methodology) introduces the MindCast AI framework—Cognitive Digital Twins, Vision Functions, and foresight simulations.
Section III (MindCast AI Vision Function Findings) presents quantified metrics across six actors.
Section IV (Merger Outcome Probabilities) compares traditional and coordination-aware frameworks.
Section V (Scenario Lattice) models four regulatory pathways through 2030.
Section VI (Behavioral Forecast) projects five phases of post-merger evolution with observable indicators.
Section VII (Regulatory Implications) identifies the critical 2026–2027 intervention window.
Section VIII (Policy Recommendations) provides implementable protocols for DOJ/FTC, state AGs, and courts.
Section IX (Conclusion) synthesizes findings and frames the analytical innovation.
Two antitrust lawsuits anchor Compass’s litigation strategy, but their implications for the merged Compass-Anywhere entity differ dramatically. A Zillow victory improves distribution terms with one portal. An NWMLS victory invalidates mandatory submission as a legal category—creating precedent across 550+ MLSs and removing the primary constraint on national opacity-routing. The merger’s risk profile depends on which litigation succeeds. Part II analyzes both, weighted by architectural consequence.
Insight: The Compass-Anywhere merger’s primary risk is architectural, not competitive. Compass acquires the capacity to alter national information topology—a harm category traditional merger review cannot detect.
II. Methodology
The MindCast AI Framework
MindCast AI is a predictive law and behavioral economics framework that models how institutions behave under pressure. Traditional antitrust tools explain competition through concentration and price; MindCast models it through coordination, drift, incentives, and institutional coherence. The system treats firms, regulators, platforms, agents, and MLSs as behavioral agents, each with measurable signatures that determine how coordination succeeds or collapses across a market.
At the core of MindCast AI are Cognitive Digital Twins (CDTs)—structured representations of an actor’s institutional architecture. Each Cognitive Digital Twin encodes an institution’s incentives, contradictions, transparency choices, throughput capacity, strategic stability, and behavioral drift. These traits are measured through Vision Functions. MindCast AI operationalizes these insights with predictive precision, turning qualitative theory into quantifiable behavioral signals. Where classical behavioral economics identifies biases and heuristics, MindCast provides the predictive mechanism: drift coefficients, contradiction tolerances, transparency decay curves, institutional inertia, national propagation indices, and scenario-based outcome distributions.
Foresight simulations are the synthesis layer. They integrate Cognitive Digital Twin metrics across actors, run them through a coordination-architecture model, and generate falsifiable scenario probabilities—forecasting coordination collapse, institutional adaptation, bifurcation into parallel architectures, or stabilization under regulatory intervention. Foresight simulations do not rely on market-share arithmetic; they model how coordination erodes or stabilizes through visibility, synchronization, and behavioral propagation.
In platform markets—where information flow, visibility, and architecture determine competitiveness—MindCast AI fills the analytical gap that standard antitrust methods cannot address. Cognitive Digital Twins reveal the structural risk of opacity-routing, drift-driven fragmentation, and focal-point erosion long before consumer harm becomes measurable. The framework equips regulators, courts, and practitioners with a predictive system for diagnosing institutional instability, testing merger scenarios, and designing remedies based on coordination integrity rather than outdated concentration metrics.
MindCast AI is therefore not a departure from the Chicago School—it is its evolution. Ronald Coase, Gary Becker, and Richard Posner provided the conceptual architecture; Cognitive Digital Twins supply the measurement infrastructure; foresight simulations turn both into forward-looking law-and-economics. Together they form a predictive discipline capable of modeling platform-era coordination failures before they become irreversible.
Application of the MindCast AI Framework
Six actors drive coordination dynamics in U.S. residential real estate: Compass, Anywhere, NWMLS, Regulators (federal and state), Agents, and Portals. Each receives full Cognitive Digital Twin quantification. Three additional actors—state AGs, local MLSs, and consumers—are modeled qualitatively where they intersect with primary actor dynamics.
Each actor is processed through nine Vision Functions that generate the structural inputs to foresight simulation outcomes:
Causation Vision – Causal signal integrity and narrative-behavior consistency
Cultural Vision – Narrative coherence, moral positioning, relational stability
Integrity Vision – Institutional coherence and contradiction tolerance
Institutional Cognitive Plasticity Vision – Adaptability, cognitive plasticity, recovery capacity
Regulatory Vision – Enforcement risk, jurisdictional synchronization
Disclosure Vision – Transparency metrics, focal-point distortion
National Innovation Behavioral Economics Vision – National throughput, propagation dynamics, synchronization
Strategic Behavioral Coordination Vision – Strategic drift, behavioral deviation, coordination tension
Scenario Foresight – Long-range scenario probability modeling
Each Vision Function generates scores ranging from 0 to 1.0 (or 0 to 2.0 for integrity metrics), enabling direct comparison across actors and systematic aggregation into scenario probabilities.
Insight: The methodology transforms qualitative Chicago School concepts—coordination costs, incentive alignment, institutional coherence—into falsifiable numeric predictions.
Contact mcai@mindcast-ai.com to partner with us on antitrust law and behavioral economics foresight simulations. See Letter to State Attorneys General on Compass-Anywhere Merger (September 2025), Compass Strategic Forum Shopping Analysis (July 2025), Compass’s Strategic Use the Co-Conspirator Narrative in Antitrust Litigation (Jul 2025), Brief of MindCast AI LLC as Amicus Curiae in Support of Defendant NWMLS (May 2025), Brief of MindCast AI LLC as Amicus Curiae in Support of Defendant Zillow (June 2025).
III. MindCast AI Foresight Simulation Vision Function Findings
Compass consistently scores as the highest-risk actor across all four metric dimensions. The following presents condensed simulation-relevant results with Cognitive Digital Twin metrics embedded to illustrate the quantitative basis for scenario probabilities.
4.1 System Integrity Analysis
System integrity metrics determine whether an entity stabilizes or destabilizes coordination architecture. Four metrics capture this dimension:
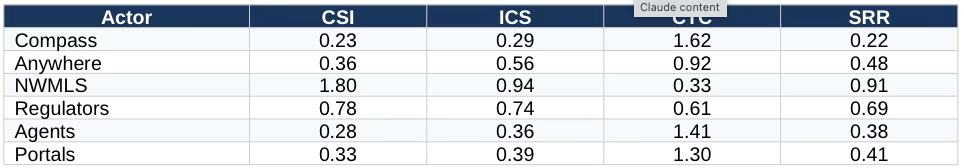
CSI (Causal Signal Integrity): Measures consistency between an actor’s claims and observed behavior. Low CSI indicates structural contradiction, making the actor unreliable in merger narratives.
ICS (Institutional Coherence Score): Captures internal alignment between strategy, operations, and messaging. Low ICS produces unpredictable behavior.
CTC (Contradiction Tolerance Coefficient): Gauges how much internal inconsistency an institution can carry without correcting. High CTC predicts drift and opacity.
SRR (Structural Recovery Rate): Reflects how quickly an entity corrects after shocks. Low SRR means instability persists and compounds.
Table 1: System Integrity Metrics by Actor
Interpretation
Compass displays the weakest structural integrity in the system. Its CSI (0.23) and CTC (1.62) represent an institution that generates contradictions faster than it resolves them—a profile incompatible with stable coordination architecture. NWMLS anchors the system with CSI of 1.80 and lowest CTC (0.33), functioning as the structural integrity benchmark. Agents and Portals show fragmentation-multiplier profiles: low CSI, high CTC, and poor recovery rates.
4.2 Coordination Architecture Analysis
System integrity determines whether an actor stabilizes or destabilizes; coordination architecture metrics determine how that instability propagates through MLS systems. These metrics directly shape market-wide matching efficiency:
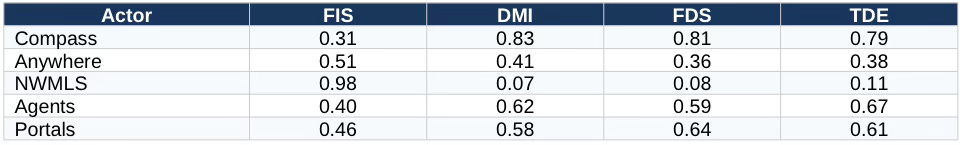
FIS (Focal-Point Integrity Score): Indicates how well an entity preserves or distorts MLS visibility norms. Low FIS destabilizes the shared reference point underlying real estate coordination.
DMI (Disclosure Manipulation Index): Measures selective, delayed, or strategic withholding of information. High DMI correlates with opacity and consumer harm.
FDS (Focal-Point Distortion Score): Captures whether an entity introduces alternative visibility channels that fragment MLS coherence.
TDE (Transparency Decay Elasticity): Assesses how fast transparency erodes under pressure. High TDE predicts rapid fragmentation once incentives shift.
Table 2: Coordination Architecture Metrics by Actor
Interpretation
Compass operates as the primary source of information fragmentation. Its DMI (0.83) and FDS (0.81) represent the highest disclosure manipulation and focal-point distortion scores in the system. Combined with low FIS (0.31), Compass systematically undermines the shared visibility infrastructure that MLS systems provide. NWMLS anchors transparency with FIS of 0.98 and near-zero manipulation scores. Portals and Agents function as distortion channels rather than stability sources.
4.3 National Throughput Analysis
Coordination architecture metrics capture what happens locally; national throughput metrics capture how fast those effects propagate. National Innovation Behavioral Economics metrics govern system-wide timing, synchronization, and risk of cascading coordination failure:
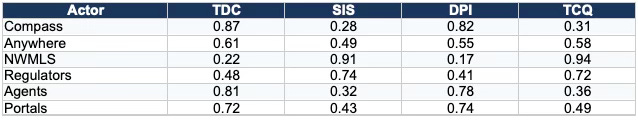
TDC (Temporal Drag Coefficient): Measures institutional slowdown. High TDC actors delay system stabilization.
SIS (Synchronization Integrity Score): Gauges how well an entity aligns with national coordination frameworks. Low SIS accelerates bifurcation.
DPI (Delay Propagation Index): Reflects how quickly local disruptions cascade into national instability.
TCQ (Throughput Coherence Quotient): Shows how effectively an institution processes and adapts to coordination shocks. High TCQ anchors system stability.
Table 3: National Throughput Metrics by Actor
Interpretation
Compass generates the highest TDC (0.87) and DPI (0.82) in the system. Compass acts as a coordination-cost multiplier: it creates the most institutional drag and propagates local disruptions to national scale faster than any other actor. NWMLS and Regulators function as throughput stabilizers. Agents amplify disruption propagation (DPI: 0.78), making them force multipliers for Compass’s drift architecture.
4.4 Behavioral Dynamics Analysis
Throughput metrics measure propagation speed; behavioral dynamics metrics predict which direction that propagation takes. Strategic Behavioral Coordination metrics determine the merged entity’s real-world behavior under stress:
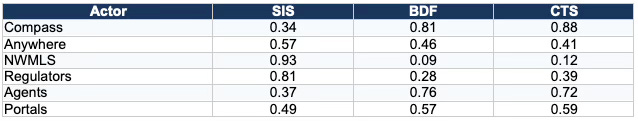
SIS (Strategic Intent Score): Higher scores indicate clear, stable strategy. Low SIS predicts erratic post-merger choices.
BDF (Behavioral Drift Factor): Measures deviation between stated intent and actual behavior. High BDF is a fragmentation risk multiplier.
CTS (Coordination Tension Score): Quantifies pressure exerted on MLS coordination architecture. High CTS accelerates opacity, misalignment, and systemic drift.
Table 4: Behavioral Dynamics Metrics by Actor
Interpretation
Compass exerts maximum destabilizing pressure on MLS coordination architecture. Its CTS (0.88) is the highest in the system, and combined with high BDF (0.81), Compass systematically deviates from stated commitments while generating coordination tension. NWMLS exhibits near-perfect strategic stability (SIS: 0.93, BDF: 0.09, CTS: 0.12). The merger would combine Compass’s drift architecture with national reach.
The behavior pattern is Becker-rational, not irrational. Gary Becker’s framework shows that actors maximize private benefits even when collective costs exceed collective gains. Agents routing listings through opacity channels capture individual commission advantages while destroying system-wide matching efficiency. Coordination externalities follow the same structure: private gains, socialized costs. The simulation’s TDC and DPI metrics map directly onto Becker’s deterrence calculus—probability of detection, expected penalty, and lag-adjusted enforcement response. When regulatory throughput runs low (TDC: 0.48) and propagation runs fast (DPI: 0.82), Becker-rational actors exploit the gap.
4.5 The Litigation–Acquisition Monopolization Strategy
The behavioral dynamics metrics confirm a pattern: Compass systematically pursues opacity as competitive advantage. The litigation strategy reveals how Compass operationalizes that pattern at the institutional level.
The NWMLS and Zillow lawsuits are not contradictory—they are components of a coordinated monopolization strategy. Both serve the same objective: dismantling coordination architecture to enable opacity-routing at scale. The Anywhere acquisition completes the strategy by providing the national platform to exploit the architectural gaps the litigation creates.
The three-pronged approach operates as follows:
NWMLS lawsuit (prong one): Remove MLS transparency requirements that constrain Private Exclusives. If Compass wins, MLSs lose the ability to mandate listing visibility—eliminating the institutional barrier to opacity-routing.
Zillow lawsuit (prong two): Force portals to distribute Private Exclusives, legitimizing shadow visibility channels. If Compass wins, non-MLS listings gain national distribution infrastructure—creating the alternative focal point necessary for coordination capture.
Anywhere acquisition (prong three): Acquire national scale to route opacity through. With Coldwell Banker, Century 21, and Sotheby’s agent networks, Compass gains the distribution capacity to operationalize whatever architectural gaps the litigation opens.
Compass pursues deliberate architectural capture—not institutional drift. The litigation clears the path; the merger provides the vehicle. Compass actively engineers coordination erosion as a competitive strategy rather than passively benefiting from it.
The Cognitive Digital Twin metrics confirm strategic intent rather than institutional dysfunction. Compass’s metric profile—lowest integrity, highest manipulation, maximum coordination tension—reflects systematic pursuit of opacity as competitive advantage. The Anywhere acquisition accelerates the trajectory from regional experimentation to national implementation.
Regulators must recognize the interdependence: the merger cannot be evaluated independently of the litigation strategy. Approving the merger while the NWMLS and Zillow cases proceed gives Compass the platform to exploit whatever architectural vulnerabilities the courts create. The three prongs operate as a unified monopolization attempt; regulatory intervention must address them together.
4.6 From Metrics to Scenarios: The Simulation Bridge
The preceding analysis establishes the metric profiles; the simulation bridge shows how those profiles generate outcome probabilities. The metrics function as predictive inputs, not descriptions. Each Cognitive Digital Twin score feeds directly into the simulation probability engine:
System integrity scores (CSI, ICS, CTC, SRR) determine institutional stability under merger stress.
Coordination architecture scores (FIS, DMI, FDS, TDE) determine focal-point erosion velocity.
Throughput scores (TDC, SIS, DPI, TCQ) determine national propagation speed.
Behavioral dynamics scores (SIS, BDF, CTS) determine drift trajectory and coordination tension.
When these inputs combine—Compass’s 0.23 CSI meeting Anywhere’s 0.61 TDC, amplified by agent BDF of 0.76—the simulation calculates scenario probabilities. The numbers produce the forecast; the forecast does not produce the numbers.
Across all four dimensions, Compass scores as the primary destabilizing force while NWMLS scores as the primary stabilizing force. The merger would nationalize the destabilizing force without proportionally expanding the stabilizing counterweight.
Insight: Cognitive Digital Twin metrics reveal that the Compass–Anywhere combination creates multiplicative risk, not additive risk. An institution with Compass’s integrity profile acquiring national reach through Anywhere generates coordination-cost explosion—a structural dynamic invisible to market-share analysis.
IV. Merger Outcome Probabilities
The Vision Function findings feed directly into merger outcome modeling. Scenario Foresight generates outcome probabilities under two analytical frameworks: traditional merger review (transaction-cost focused) and coordination-aware review (incorporating the Cognitive Digital Twin metrics above). The divergence between frameworks reveals the analytical blind spot in conventional antitrust.
Table 5: Framework Comparison—Merger Outcome Probabilities
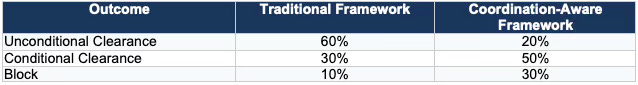
Why Traditional Analysis Fails Here
Traditional merger review evaluates concentration (HHI), price effects, and output restrictions. These metrics assume competition occurs through price signals in discrete product markets. Real estate coordination operates differently:
Harm is matching inefficiency, not price elevation. Buyers and sellers fail to find each other—a coordination cost invisible to price analysis.
Market share understates architectural control. Compass’s 6% transaction share masks its capacity to route opacity through 30%+ of agent touchpoints.
Consolidation effects are multiplicative, not additive. Scale × Drift × Opacity × Agent Amplification compounds; HHI addition does not capture this.
Focal-point erosion is structural, not behavioral. Once MLS visibility fragments, reconstitution is prohibitively costly—a ratchet effect traditional analysis ignores.
The 40-percentage-point gap between traditional clearance probability (60%) and coordination-aware clearance probability (20%) measures the analytical blind spot.
Critical Takeaway
Coordination-aware analysis inverts traditional merger expectations. Once coordination architecture enters the framework, unconditional clearance becomes the least likely outcome—a complete reversal from conventional HHI-based review. The metric profiles mechanically generate these probability shifts.
Insight: Traditional review sees market shares; coordination-aware review sees architectural risk. The 40-point clearance probability gap quantifies what traditional analysis misses.
V. Scenario Lattice (2025–2030)
Part I established the baseline coordination collapse probability at 48%—derived from Compass’s conduct-level CSI (0.37), CTS (0.72), and the structural tension between Private Exclusive strategy and MLS architecture. The scenarios below model how merger clearance pathways shift that baseline.
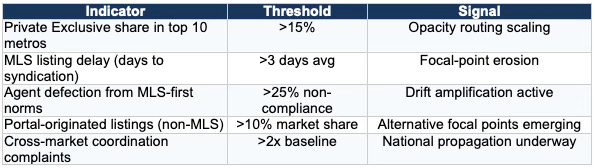
Scenario A: Unconditional Clearance → Accelerated Fragmentation
Probability: ~30%
Unconditional clearance unleashes Compass’s drift architecture at national scale. Coordination collapse risk rises from 48% baseline to approximately 62%.
Compass–Anywhere expands opacity-routing and alternative focal points nationally.
Agents and portals amplify fragmentation as force multipliers.
MLS focal-point architecture degrades in coastal metros by 2027.
The merged entity’s national footprint enables coordination disruption to propagate faster (Compass DPI: 0.82) than regulatory or MLS responses can stabilize.
Table 6: Scenario A Leading Indicators
Scenario B: Block → Architectural Stabilization
Probability: ~20%
A block affirms MLS architecture as structural market infrastructure. Coordination collapse risk drops to approximately 35%.
Compass weakens; MLS-centric systems strengthen through precedent.
Creates jurisprudential foundation for coordination-cost analysis in future cases.
A block anchors NWMLS-type systems as the coordination standard and constrains opacity-routing strategies industry-wide.
Scenario C: Conditions → Hybrid Architecture (Modal Outcome)
Probability: ~40%
Conditional clearance constrains but does not neutralize Compass’s drift architecture. A hybrid regime emerges: MLS focal points coexist with shadow visibility channels.
• Coordination collapse risk stabilizes at approximately 45–50%.
• Ongoing regulatory monitoring required to prevent drift toward Scenario A.
Behavioral commitments and disclosure requirements limit Compass’s opacity-routing capacity without eliminating its structural incentives. The result is a dual-track architecture requiring sustained oversight.
Table 7: Scenario C Stability Indicators
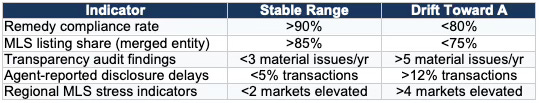
Regulators should monitor these indicators quarterly. Sustained drift toward the right column signals transition from Scenario C toward Scenario A, warranting enforcement escalation.
Scenario D: Clearance + Strategic Reversal
Probability: ~10%
Internal friction forces Compass toward MLS-aligned transparency norms. Coordination collapse risk drops to approximately 30%.
Compass’s drift architecture proves unsustainable at scale, triggering internal correction.
Strategic reversal requires Compass’s leadership to recognize that high-CTS/high-BDF strategies undermine long-term competitive position. Historical patterns (Compass CSI trend, SRR of 0.22) suggest Compass lacks the institutional capacity for such correction.
The four scenarios span a 32-point range in collapse probability (30% to 62%). Scenario C (conditional clearance) emerges as modal at 40% probability, reflecting the likelihood that regulators perceive some risk but lack the analytical framework to justify outright block.
Insight: Regulatory choice determines architecture. The scenarios are not predictions of what will happen—they are predictions of what happens under each regulatory pathway. The foresight simulation gives regulators the ability to see downstream consequences before selecting a path.
VI. Behavioral Forecast for a Merged Compass-Anywere (2025–2030)
The scenario lattice identifies four outcome paths; the behavioral forecast models what happens within each path over time. Assuming Scenario C (conditional clearance) as the modal outcome, the foresight simulation projects five phases of post-merger behavioral evolution. Each phase includes observable indicators that regulators and market participants can monitor to assess trajectory.
Phase 1: Integration Shock (2026)
Integration compounds instability rather than resolving it. Compass’s drift architecture (BDF: 0.81) collides with Anywhere’s legacy inertia (TDC: 0.61), producing early focal-point distortions as operational systems conflict. Anywhere’s moderate stability scores provide temporary friction against Compass’s high-drift tendencies, but Compass’s lower SRR (0.22 vs. 0.48) means integration problems accumulate.
Observable indicators: Agent attrition exceeds 15% in legacy Anywhere brands. Internal policy conflicts surface publicly. MLS compliance rates diverge across merged entity’s regional operations. Technology platform integration delays exceed 6 months. Early Private Exclusive expansion into Coldwell Banker/Century 21 listings.
Phase 2: Drift Expansion (2026–2027)
Compass extends its opacity model nationally through Anywhere’s network. Portals (FDS: 0.64) become alternative visibility rails, fragmenting MLS coherence. Agent networks (BDF: 0.76, CTS: 0.72) amplify drift dynamics. Regional variation emerges as markets with strong local MLS systems (NWMLS-type) resist while weaker markets fragment.
Observable indicators: Private Exclusive share exceeds 10% in top 20 metros. Portal-originated listing traffic grows >25% year-over-year. Agent complaints to state regulators increase 2x baseline. MLS listing delays exceed 48 hours in >5 major markets. Compass marketing emphasizes ‘exclusive access’ over MLS reach.
Phase 3: National Bifurcation Pressure (2027–2028)
Coastal metros develop parallel coordination systems. Markets divide between MLS-anchored architecture and Compass-dominated shadow channels. Matching efficiency degrades in fragmented markets. Regulators (TCQ: 0.72) begin intervention but jurisdictional fragmentation constrains their throughput.
Observable indicators: Days-on-market variance exceeds 30% between MLS-listed and Private Exclusive properties. Consumer complaints regarding ‘hidden inventory’ spike in coastal markets. State AG investigations open in 3+ jurisdictions. Industry trade groups issue formal opposition statements. Buyer agent showing access complaints exceed 1,000/month nationally.
Phase 4: Strategic Inflection (2029)
Compass faces a structural contradiction it cannot resolve through drift. The company oscillates between transparency concessions (under regulatory pressure) and renewed opacity (following competitive incentives). This oscillation reflects the fundamental tension between Compass’s high-CTS architecture and coordination-system requirements. Outcome depends on regulatory persistence and strength of MLS institutional response.
Observable indicators: Compass announces and then reverses transparency commitments within 12-month cycles. Executive turnover in compliance/legal functions exceeds industry norms. Shareholder pressure emerges regarding regulatory risk. Settlement discussions with DOJ/FTC or state AGs become public. MLS systems implement defensive rule changes.
Phase 5: Divergence or Stabilizing Pivot (2030)
70% probability — Long-run fragmentation: Compass’s institutional architecture proves unable to sustain coordination-compatible behavior. National real estate coordination degrades into regional systems with inconsistent information topology. Consumer matching efficiency drops 15-25% in fragmented markets. The coordination architecture that enabled efficient price discovery erodes permanently.
30% probability — MLS-aligned stabilization: Through regulatory pressure, market discipline, or internal strategic reversal, Compass adopts transparency norms compatible with coordination architecture. This requires sustained improvement in CSI (from 0.23 toward 0.60+) and reduction in CTS (from 0.88 toward 0.50)—trajectories not currently observable but achievable under consent decree or leadership change.
The divergence point is not predetermined. Regulatory action in 2026-2027 significantly influences which branch materializes. Inaction during the critical window increases fragmentation probability from 70% toward 85%.
Insight: The behavioral forecast is falsifiable. Each phase includes observable indicators that either confirm or disconfirm the projection. By 2028, regulators can assess whether the foresight simulation accurately predicted post-merger dynamics—and adjust intervention accordingly.
VII. Regulatory Implications for 2026–2027
The behavioral forecast identifies Phase 2 (2026-2027) as the critical inflection period. Regulatory choices made during this window determine whether coordination architecture stabilizes or fragments. The next 18 months represent the critical intervention window: action taken before Q3 2027 can shape coordination architecture; action after that point becomes remedial rather than preventive.
Q1–Q2 2026: Decision Point
Merger review concludes. The clearance pathway selected—unconditional, conditional, or block—locks in the initial trajectory. Conditional clearance requires immediate remedy implementation; delays compound through Compass’s high DPI (0.82).
If unconditional: Begin monitoring Scenario A indicators immediately. Establish baseline metrics for Private Exclusive penetration and MLS listing delays.
If conditional: Implement Scenario C monitoring framework. Quarterly compliance reviews with enforcement triggers at threshold crossings.
If blocked: Compass remains constrained to organic growth. Monitor for alternative opacity strategies through portal partnerships or agent network capture.
Q3–Q4 2026: Integration Stress Test
Compass–Anywhere integration (if cleared) enters operational phase. Agent network harmonization creates the first test of drift architecture at scale. Regulators should monitor:
Agent retention and defection patterns across legacy Anywhere brands
MLS compliance rates by regional market
Disclosure timing variances between Compass-originated and Anywhere-originated listings
Q1–Q2 2027: Inflection Assessment
By mid-2027, coordination architecture trajectory becomes observable. Either MLS focal-point integrity holds (Scenario B/C indicators stable) or fragmentation accelerates (Scenario A indicators crossing thresholds). This assessment determines whether regulatory posture shifts from monitoring to intervention.
The foresight simulation projects that failure to intervene by Q3 2027—if Scenario A indicators are elevated—increases coordination collapse probability from 48% to >55%. The window for preventive action narrows significantly after this point.
The quarterly framework provides regulators with a structured monitoring protocol. Each quarter offers specific indicators to track and decision points to evaluate.
Insight: Timing matters more than intensity. Early conditional intervention (Q1-Q2 2026) produces better coordination outcomes than aggressive intervention after fragmentation has progressed (2028+). The foresight simulation enables regulators to act early by making future consequences visible now.
VIII. Policy Recommendations
The regulatory timeline establishes when to act; the policy recommendations establish what to do. The recommendations below follow Richard Posner’s institutional design logic: courts and regulators should focus on predictable, administrable rules that track real-world behavior rather than abstract doctrinal categories. Posner repeatedly warned that concentration metrics serve as weak proxies for competitive harm when institutional behavior drives outcomes—precisely the situation the Compass–Anywhere merger presents. The framework prioritizes administrable monitoring over formalistic market-share thresholds. Coordination architecture is measurable; opacity is not. Regulators should act on what they can observe and enforce.
For the US DOJ/FTC
Treat MLS coordination as market infrastructure. Recognize that MLS systems solve coordination costs, not merely transaction costs. Harm analysis should incorporate focal-point stability, trust density, and information synchronization.
Incorporate coordination-cost metrics into merger review. CSI, DMI, CTS, and throughput metrics capture structural risks invisible to HHI-based analysis. The Compass–Anywhere merger presents a test case for this analytical extension.
Require visibility and interoperability conditions. If conditional clearance, mandate MLS listing participation, disclosure timelines, and interoperability with MLS data systems. Behavioral commitments should target DMI and FDS reduction.
Condition approval on litigation posture. The NWMLS and Zillow lawsuits form part of a unified monopolization strategy. Require dismissal or settlement of coordination-attacking litigation as a merger condition.
Establish ongoing monitoring with enforcement triggers. Quarterly reporting on Private Exclusive volume, MLS compliance rates, and disclosure timing. Automatic investigation triggers when Scenario A indicators cross thresholds.
Specific remedy targets: DMI reduction from 0.83 to below 0.50 within 24 months. MLS listing share maintained above 90% for merged entity. Private Exclusive cap of 5% of total listings.
For State Attorneys General
• Coordinate enforcement to reduce throughput drag. Multi-jurisdictional enforcement creates temporal drag (regulator TDC: 0.48) that delays stabilization. Coordination among state AGs accelerates response to opacity-routing strategies.
• Monitor local MLS stress points. Compass’s delay propagation (DPI: 0.82) means local market disruptions cascade nationally. Early intervention at regional stress points prevents coordination collapse from spreading.
• Pursue state-level consumer protection actions. Private Exclusives create information asymmetry that constitutes unfair or deceptive practice under state consumer protection statutes. Document consumer harm through matching inefficiency data.
• Form multi-state working group. Establish formal coordination mechanism for real estate market monitoring, similar to state AG coalitions in pharmaceutical and tech antitrust. Share data on regional coordination indicators.
Priority states: Washington (NWMLS litigation), California, New York, Texas, Florida (largest Compass/Anywhere footprints). Early-mover states can establish precedent for national enforcement.
For Courts
Recognize coordination architecture as a structural market feature. Antitrust doctrine should acknowledge that focal-point erosion and trust degradation constitute cognizable harms distinct from price effects. The NWMLS litigation (Compass, Inc. v. NWMLS) provides the doctrinal vehicle for this recognition.
Apply coordination-cost framework to transparency rule challenges. When evaluating MLS rules requiring listing disclosure, courts should assess whether the rules reduce coordination costs—not merely whether they restrain individual broker conduct.
Admit coordination-cost expert testimony. Cognitive Digital Twin methodology meets Daubert standards: it applies established economic principles (Coase, Becker, Posner) through quantified metrics with falsifiable predictions. Courts should permit expert testimony on coordination architecture harm.
The NWMLS case presents the first opportunity for judicial recognition of coordination-cost economics. A ruling that MLS transparency rules serve procompetitive coordination functions would establish precedent applicable to the merger review and future platform cases.
The recommendations share a common structure: they operationalize coordination-cost economics through administrable rules, measurable metrics, and observable indicators. Each recommendation can be implemented within existing legal frameworks.
Insight: The policy recommendations are not abstract principles—they are implementable protocols. Each includes specific metrics, thresholds, and monitoring mechanisms that translate foresight simulation analysis into regulatory action.
IX. Conclusion
The Compass–Anywhere merger presents a structural test—not a traditional consolidation case. Regulators must determine whether they can perceive and protect coordination architecture as a foundational market institution.
Compass’s Cognitive Digital Twin signature identifies an institution that generates coordination costs rather than reducing them. Anywhere’s legacy reach provides the national platform. Agents and portals function as drift amplifiers. Only NWMLS-type systems and coordinated regulatory action provide stabilizing counterforce.
Unconditional approval accelerates national coordination fragmentation. Coordination-aware review offers paths to stability through block or carefully structured conditions with ongoing oversight.
Part II represents an analytical innovation: the first application of coordination-cost economics to merger review. Traditional antitrust analysis evaluates whether mergers reduce competition; coordination-cost analysis evaluates whether mergers destabilize the institutional architecture that enables competition to function. The questions differ, and so do the answers.
Law and behavioral economics assessment of Compass’s Coasean Coordination Problem demonstrates that merger review can be extended beyond concentration metrics to capture the structural dynamics that determine whether markets coordinate or fragment. The question is whether regulators will adopt this framework before the architecture it measures has already collapsed.
Insight: The Compass–Anywhere merger is a test case—not just for this transaction, but for whether antitrust analysis can evolve to address platform-era coordination failures. MindCast AI provides the analytical infrastructure. The decision to use it rests with regulators.
Decision-Maker Synthesis
THE MERGER
Compass acquires Anywhere (Coldwell Banker, Century 21, Sotheby’s), creating the largest U.S. brokerage by agent count.
THE RISK
Coordination architecture collapse—not market concentration. MLS focal points fragment; matching efficiency degrades nationally.
KEY METRICS
• Compass CSI: 0.23 (lowest integrity) | NWMLS CSI: 1.80 (highest integrity)
• Compass CTS: 0.88 (maximum coordination tension)
• Compass DMI: 0.83 (highest disclosure manipulation)
SCENARIO PROBABILITIES
• Unconditional clearance → 62% collapse risk (Scenario A: 30%)
• Block → 35% collapse risk (Scenario B: 20%)
• Conditional clearance → 45–50% collapse risk (Scenario C: 40%, modal)
• Strategic reversal → 30% collapse risk (Scenario D: 10%)
CRITICAL WINDOW
Q1 2026 – Q2 2027. Regulatory action before Q3 2027 shapes architecture; action after becomes remedial.
BOTTOM LINE
Traditional review clears at 60%. Coordination-aware review clears at 20%. The 40-point gap measures the analytical blind spot.
Appendix: Metrics and Definitions
Note on Metric Differences Between Part I and Part II in the MindCast AI Series
The quantitative differences between the metrics reported in Part I and Part II reflect a change in modeling context, not inconsistency in evaluation.
Part I assessed Compass’s conduct in a conceptual and diagnostic frame, focusing on whether coordination costs were being introduced into a market designed to minimize them. The metrics in that section were calibrated to identify the presence and direction of coordination degradation, using publicly observable behavior and stated strategic narratives. At that stage, the analysis asked whether the conduct could plausibly be characterized as experimentation or edge-case behavior within an otherwise competitive system.
Part II re-evaluates the same conduct under scale and amplification conditions introduced by the Compass–Anywhere transaction. Metrics such as behavioral drift, coordination tension, and causal coherence are recalibrated to reflect merger-driven incentives, national replication effects, and persistence under expansion pressure. As a result, certain scores increase or harden, not because the underlying behavior changed, but because the institutional context did. Conduct that might appear marginal at local scale becomes structurally consequential when combined with national distribution, acquisition-driven incentives, and reduced opportunity for self-correction.
The stability of several other metrics across Parts I and II is itself informative, indicating that the core behavioral pattern persists as scale increases. The Part II metrics therefore do not revise Part I’s conclusions; they extend them by showing how the same conduct compounds under merger conditions relevant to regulatory review.
System Integrity Metrics
CSI (Causal Signal Integrity): Consistency between claims and observed behavior. Range: 0–2.0. Above 1.0 indicates structural coherence.
ICS (Institutional Coherence Score): Internal alignment of strategy, operations, messaging. Range: 0–1.0.
CTC (Contradiction Tolerance Coefficient): Capacity to carry internal inconsistency. Range: 0–2.0. Higher indicates drift risk.
SRR (Structural Recovery Rate): Speed of correction after shocks. Range: 0–1.0.
Coordination Architecture Metrics
FIS (Focal-Point Integrity Score): Preservation of MLS visibility norms. Range: 0–1.0.
DMI (Disclosure Manipulation Index): Strategic information withholding. Range: 0–1.0. Higher indicates opacity.
FDS (Focal-Point Distortion Score): Introduction of alternative visibility channels. Range: 0–1.0.
TDE (Transparency Decay Elasticity): Speed of transparency erosion under pressure. Range: 0–1.0.
National Throughput Metrics
TDC (Temporal Drag Coefficient): Institutional slowdown effect. Range: 0–1.0. Higher delays stabilization.
SIS (Synchronization Integrity Score): Alignment with national coordination. Range: 0–1.0.
DPI (Delay Propagation Index): Speed of local-to-national disruption cascade. Range: 0–1.0.
TCQ (Throughput Coherence Quotient): Effectiveness at processing coordination shocks. Range: 0–1.0.
Behavioral Dynamics Metrics
SIS (Strategic Intent Score): Clarity and stability of strategy. Range: 0–1.0.
BDF (Behavioral Drift Factor): Deviation between intent and action. Range: 0–1.0. Higher multiplies fragmentation.
CTS (Coordination Tension Score): Pressure on coordination architecture. Range: 0–1.0. Higher accelerates drift.