

MCAI Lex Vision: Compass’s Coasean Coordination Problem Part I, How Private Exclusives Reshape Competition and Threaten MLS Stability
A Foresight Simulation of Coordination Costs, Antitrust Exposure, and the NWMLS Litigation Trajectory (2025–2030)

MindCast AI Compass’s Coasean Coordination Problem series is part of our Chicago School Accelerated Part I: Coase and Why Transaction Costs ≠ Coordination Costs (December 2025) framework, with sub-series:
Part I How Private Exclusives Reshape Competition and Threaten MLS Stability
Part III Coordination Costs, MLS Governance and the Compass Litigation
Part IV Platform Routing, Portal Power, and the Zillow Litigation
I. Executive Summary
The Controversy
Compass, the nation’s largest residential brokerage, is suing the Northwest Multiple Listing Service (NWMLS) in federal court, claiming that MLS transparency rules violate antitrust law. The company argues that requiring timely public listing constitutes an anticompetitive restraint—that sellers should have “choice” to market homes privately through Compass’s “Private Exclusive” network before exposing them to the broader market.
The US FTC and DOJ appear sympathetic to this framing. Federal regulators have spent years scrutinizing MLS cooperation, commission structures, and data-sharing rules as potential cartel behavior. The implicit theory: MLS rules create friction that restrains competition; removing rules liberates markets.
The theory is wrong. And if regulators act on it, they risk destabilizing America’s largest asset market.
The Problem: Wrong Framework, Wrong Diagnosis
Federal antitrust analysis applies transaction cost economics to residential real estate—treating MLS as friction-generating cartels. But MLS systems do not create transaction costs. MLS systems solve a different problem entirely: coordination costs.
Transaction costs measure friction within the bargaining mechanism—legal fees, search costs, information asymmetry. Coordination costs measure whether the bargaining mechanism can engage at all. The categories are analytically independent. A market can have zero transaction costs and catastrophic coordination failure.
Residential real estate faces severe coordination challenges: heterogeneous goods that cannot be compared through price signals alone; millions of one-time participants who lack experience to coordinate efficiently; compressed timeframes that do not permit extended search; and stakes measured in hundreds of thousands of dollars per transaction. MLS systems solve these challenges through focal points (shared reference for where listings appear), trust infrastructure (verified data, professional accountability), and narrative alignment (common understanding of how markets operate).
When regulators dismantle coordination architecture while believing they are reducing transaction costs, they destroy the mechanisms that enable efficient matching. The result is not liberated competition—it is fragmented markets where buyers cannot find sellers, sellers cannot assess exposure, and matching efficiency collapses.
The Approach: Foresight Simulation
MindCast AI uses Cognitive Digital Twins (CDT), behavioral economics, and law-and-economics modeling to simulate how Compass’s Private Exclusives reshape coordination architecture and long-range competitive stability. Rather than retrospective analysis or linear forecasting, foresight simulation captures the incentives, structural pressures, and strategic counterplays that drive system trajectories.
The simulation models three actors—MLS systems, Compass, and federal regulators—across metrics measuring causal integrity, institutional responsiveness, strategic coordination, and adaptability. The output: quantified predictions about market structure, litigation outcomes, and regulatory behavior through 2030.
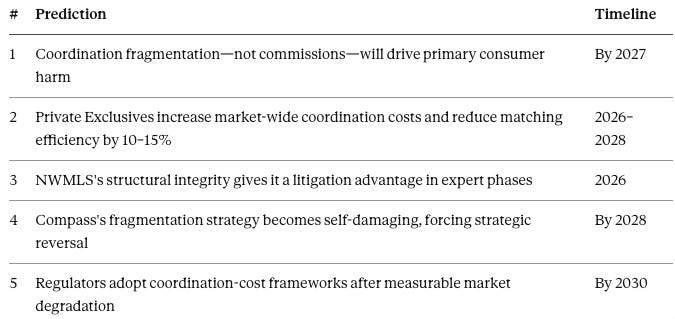
Five Headline Predictions
Where Markets Are Headed: Three Scenarios by 2030
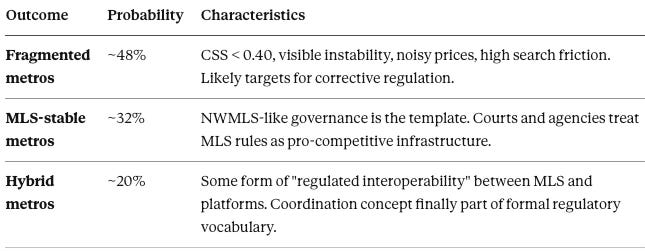
The simulation projects three possible equilibria for U.S. residential real estate by 2030:
Scenario A: Coordination Collapse (48% probability) High-competition metros fragment into incompatible listing systems. Buyers cannot know if their search is complete. Sellers cannot assess market exposure. Price discovery degrades. Time-on-market increases. Search friction rises 20–40%. Trust between market participants falls below the threshold required for cooperative behavior. Markets begin to resemble the fragmented, opaque classified-ad systems of the early 2000s.
Scenario B: MLS Stability (32% probability) Regions with strong MLS governance—NWMLS being the archetype—maintain coordination architecture. Courts and regulators recognize MLS rules as pro-competitive infrastructure rather than cartel restraints. These regions outperform fragmented markets on liquidity, price discovery, and consumer welfare.
Scenario C: Hybrid Architecture (20% probability) A compromise emerges through regulation or private compacts: MLS remains the core coordination layer, but platform interoperability and data-sharing standards create partial bridges between systems. The coordination-cost framework enters formal regulatory vocabulary.
Nearly half probability of coordination collapse under current regulatory trajectory. The window for intervention is 2025–2027, before fragmentation becomes self-reinforcing.
Roadmap
Section II introduces the core distinction between transaction costs and coordination costs, extending Ronald Coase’s framework to capture coordination failures that transaction cost analysis cannot see.
Section III applies this framework to residential real estate, explaining why MLS systems exist and what they actually do.
Section IV presents a decision matrix revealing the blind spot in current regulatory analysis—and a visual foresight map tracking system trajectory through 2030.
Section V models three macro-scenarios with sub-predictions and probability estimates.
Section VI presents the CDT metrics underlying the simulation: causal signal integrity, institutional responsiveness, behavioral drift, credibility tension, and adaptability scores for MLS, Compass, and regulators.
Section VII applies the framework to Compass’s litigation posture, revealing a structural inconsistency that transaction cost analysis cannot detect.
Sections VIII–X consolidate predictions, analyze merger implications for the Compass-Anywhere transaction, and prescribe regulatory reforms.
Why Read This
The FTC and DOJ lack a behavioral-economic framework for the coordination problems they are evaluating. Courts adjudicating MLS litigation lack metrics for coordination architecture health. Investors pricing real estate platforms lack tools to assess coordination risk.
This publication provides that framework—with quantified predictions, measurable metrics, and falsifiable claims. If the predictions hold, this analysis will be cited in expert reports, policy papers, and judicial opinions. If they fail, the framework will be revised.
Either way, the coordination-cost lens reveals dynamics that transaction-cost analysis systematically misses. The stakes—efficient matching in a $45 trillion asset market—justify the attention.
Contact mcai@mindcast-ai.com to partner with us on law and behavioral economics foresight simulations. See Contact mcai@mindcast-ai.com to partner with us on antitrust law and behavioral economics foresight simulations. See Letter to State Attorneys General on Compass-Anywhere Merger (September 2025), Compass Strategic Forum Shopping Analysis (July 2025), Compass’s Strategic Use the Co-Conspirator Narrative in Antitrust Litigation (Jul 2025), Brief of MindCast AI LLC as Amicus Curiae in Support of Defendant NWMLS (May 2025), Brief of MindCast AI LLC as Amicus Curiae in Support of Defendant Zillow (June 2025).
II. The Core Distinction: Transaction Costs vs. Coordination Costs
The executive summary introduced the distinction between transaction costs and coordination costs. This section develops the theory: where the distinction comes from, why Coase’s original framework misses it, and how to measure coordination failure.
What Coase Established
Ronald Coase won the Nobel Prize for demonstrating that private parties bargain to efficient outcomes when transaction costs are low. Coase, Ronald H., The Problem of Social Cost, Journal of Law and Economics, Vol. 3 (October 1960). For sixty years, the Coase Theorem has anchored law and economics: reduce friction—legal fees, search costs, information asymmetries—and efficient allocation follows.
What Coase Left Implicit
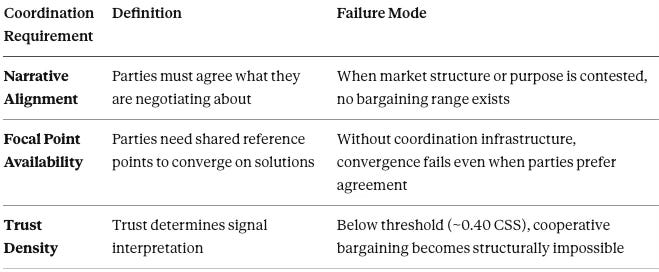
Coase’s framework embeds a hidden assumption: parties can identify the efficient equilibrium and coordinate toward it. The assumption holds for Coase’s canonical examples—the rancher and farmer share a stable environment, common problem understanding, and sufficient time to negotiate. The assumption fails in complex, high-velocity systems where three coordination requirements break down:
The critical insight: Transaction costs measure friction within the bargaining mechanism. Coordination costs measure whether the mechanism can engage at all. The categories are analytically independent: a system can have zero transaction costs and catastrophic coordination costs.
Anchor Example: The Fragmented Search Problem
Consider a buyer relocating to Seattle in 2019 versus 2029 under a fragmented listing regime. In 2019, the buyer searches NWMLS-fed platforms and sees 94% of available inventory. The coordination architecture works: one search, comprehensive results, common data standards.
Now imagine 2029 after coordination architecture has been dismantled under transaction-cost logic. The buyer must search: Compass internal network (Private Exclusives), Zillow public feed, Redfin direct listings, individual brokerage sites, social media marketplaces, and off-MLS “pocket listing” networks. Each platform has different data standards, different update frequencies, different coverage.
The transaction costs are identical—the buyer still has a phone and internet access. But coordination costs have exploded. The buyer cannot know if search is complete. Sellers cannot know if they have reached all buyers. The market fragments into incompatible visibility silos where matching efficiency collapses.
Markets with high Private Exclusive penetration already exhibit these dynamics. The coordination cost framework predicts the outcome; transaction cost analysis cannot see it.
The Extended Formula
Original Coase: Efficient outcome = f(low transaction costs, clear property rights)
Behavioral Economics Extension: Efficient outcome = f(transaction costs, institutional throughput, coordination architecture)
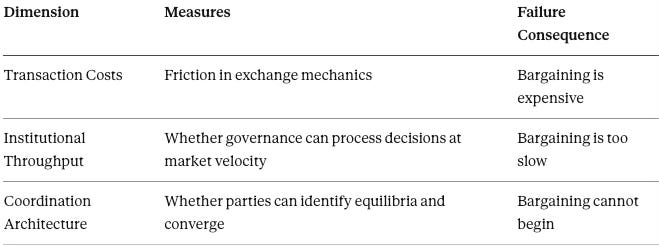
All three dimensions must be favorable for efficient bargaining. Failure in any dimension blocks the Coasean mechanism—even when transaction costs are zero.
The Coase Theorem remains valid within its boundary conditions. But those conditions assume coordination capacity that must be built and maintained. Regulators who reduce transaction costs while destroying coordination architecture will degrade market efficiency—the opposite of their intent.
Insight: Transaction costs and coordination costs are analytically independent. Optimizing one while ignoring the other produces systematic policy failure.
III. Application to Residential Real Estate
The framework above applies to any complex market. Residential real estate presents an extreme case—the structural features that create coordination dependence are more severe here than in almost any other market. This section details those features and explains how MLS systems address them.
The Coordination Problem in Housing Markets
Five structural features make residential real estate uniquely dependent on coordination architecture:
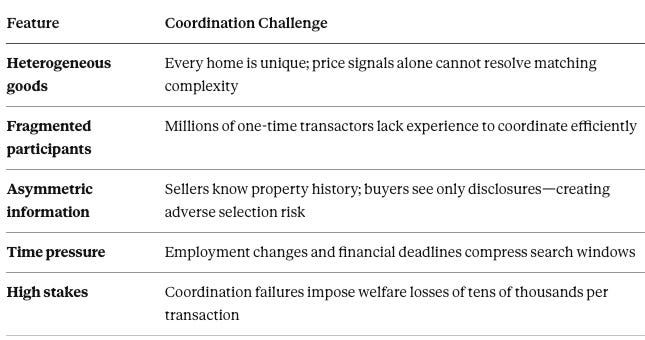
The friction is not in the mechanics of exchange—that would be a transaction cost problem. The friction is in the ability of dispersed parties to find each other, establish common expectations, and converge on efficient matches. That is a coordination cost problem.
What MLS Systems Actually Do
Multiple Listing Services solve coordination costs through three mechanisms:
1. Focal Point Creation
MLS systems establish where listings appear, how information is structured, and what rules govern participation. These shared reference points enable convergence without requiring bilateral negotiation. When a seller lists a property, both seller and buyers share a common understanding of where the property is visible and under what terms.
Without this focal point, the market fragments. Buyers search across platforms with no guarantee of completeness. Sellers cannot assess exposure. The coordination mechanism fails even though no transaction cost barrier exists.
2. Trust Infrastructure
MLS systems create verified data standards, professional accountability, and dispute resolution mechanisms. This trust infrastructure determines how market signals are interpreted.
High trust: listing information is understood as accurate; compensation offers are binding; participation implies reciprocal obligation. Low trust: identical signals are read as fraudulent, self-serving, or misleading.
The Coordination Stability Score (CSS) measures trust density. Below the ~0.40 threshold, cooperative market behavior becomes structurally impossible regardless of transaction costs.
3. Narrative Alignment
MLS systems establish shared understanding of what the market is and how it operates. Participants agree (implicitly) that listing is standard practice, that exposure serves seller interests, that compensation arrangements follow understood patterns.
When narrative alignment fails—when participants hold competing definitions of market structure—no bargaining range exists. This is precisely what occurs when “private exclusive” models fragment the market into incompatible coordination systems.
The “Cartel” Framing Error
Antitrust regulators analyzing MLS cooperation through transaction cost logic see: rules requiring listing, compensation structures, data sharing agreements. The cartel frame interprets these as barriers to competition—friction that restrains trade and should be eliminated.
The coordination cost framework reveals the opposite: these mechanisms are not barriers to competition but prerequisites for competition. They solve the coordination problem that would otherwise prevent efficient matching.
The analytical error: Treating coordination infrastructure as transaction cost friction is equivalent to treating highway systems as barriers to transportation. The infrastructure enables the activity it appears to “constrain.”
MLS systems emerged because residential real estate markets cannot function without coordination architecture. Dismantling these rules does not liberate competition—it prevents competition from occurring.
Insight: MLS systems are not cartels that restrain trade. They are coordination infrastructure that enables trade which would otherwise be impossible.
IV. The Regulator Decision Matrix
Regulatory analysis requires a framework for identifying where intervention helps versus where intervention harms. This section introduces a decision matrix that maps both transaction costs and coordination costs, revealing the blind spot in current antitrust enforcement. The matrix explains why well-intentioned regulatory action can destabilize the markets it intends to protect.
Current regulatory analysis focuses almost exclusively on one quadrant. The coordination cost framework reveals that other quadrants present greater systemic risk:
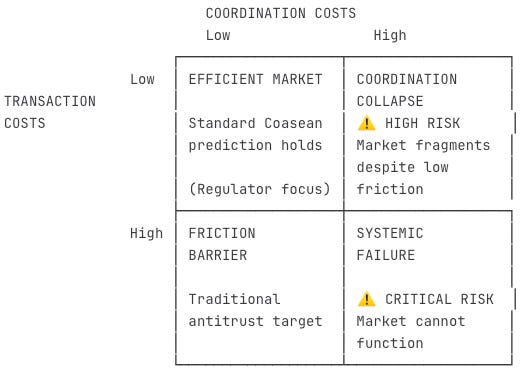
Where regulators focus: Lower-left quadrant (high transaction costs, low coordination costs). Traditional antitrust targets friction barriers that prevent otherwise-capable parties from bargaining.
Where the real risk lies: Upper-right quadrant (low transaction costs, high coordination costs). Markets where mechanical barriers are absent but coordination architecture has collapsed. This is where Private Exclusive proliferation pushes residential real estate.
The blind spot: Regulators optimizing for the lower-left quadrant may inadvertently push markets into the upper-right quadrant by dismantling coordination infrastructure they mistake for transaction cost friction.
Visual Foresight Map: System Trajectory (2025–2030)
Think of this as a 2×2 map plus a trajectory arrow.
Axes:
X-axis: Coordination Architecture Health (Low → High)
Y-axis: Regulatory Conceptual Quality (Transaction-Only → Transaction + Coordination)
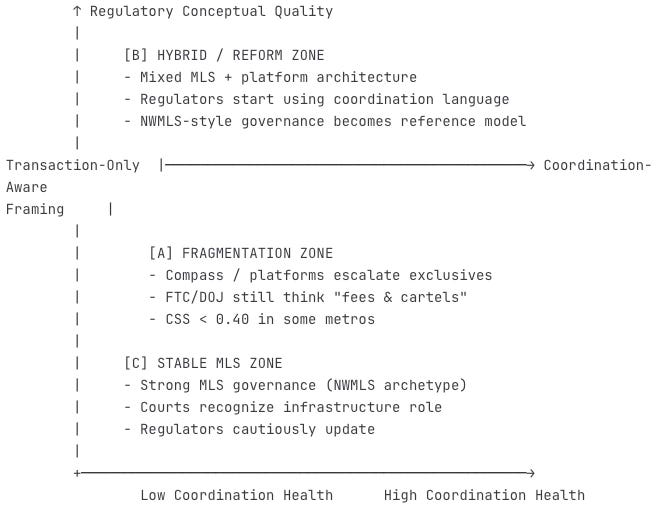
System Trajectory (2025–2030)
Starting point (2025):
Mid-right horizontally (coordination relatively healthy)
Low vertically (regulators transaction-obsessed)
2026–2027 drift:
Arrow drifts left in some metros (coordination degradation) as Private Exclusives/platform silos grow
Vertical position mostly unchanged (regulators still not “getting” coordination)
2028–2030 pivot:
Evidence of harm forces regulators to move upward vertically
Some courts and policy shops start to treat MLS as infrastructure
Hybrid zone [B] appears: partial reforms, experimental rules, interoperability
Net picture: The system drifts from “High coordination / Low conceptual clarity” toward “Mixed coordination / Improving conceptual clarity,” with pockets of true fragmentation [A] unless someone intervenes hard in favor of MLS-style architecture [C].
The intervention point: This publication provides the conceptual framework that enables the vertical movement—shifting regulatory understanding from transaction-only to coordination-aware. Without that shift, the system drifts into fragmentation by default.
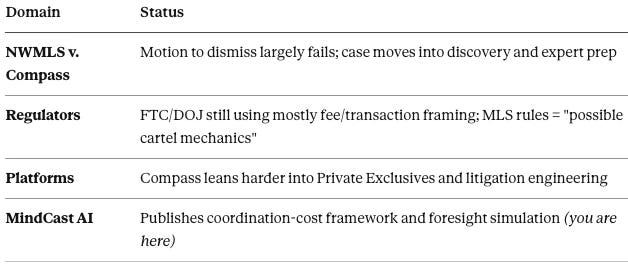
Chronological Foresight Arc (2025–2030)
The timeline below keys the foresight simulation predictions to the NWMLS case, Compass behavior, and regulator learning curve.
2025
2026
Q1–Q2:
Expert disclosure and rebuttal schedule in NWMLS case
First serious use of “coordination architecture” arguments possible in expert reports
Market behavior:
Fragmentation begins to show up as:
More off-market deals
Inconsistent comparables
Noisier pricing in certain metros
Regulators:
Still transaction-cost focused
High TDC (0.74); low institutional plasticity (IUV 0.31)
2027
Coordination Harm Becomes Empirical:
Longer time-on-market in fragmented metros compared to MLS-stable regions
Agents and brokerages report growing search friction and information asymmetry
Consumer complaints rise around “opaque” listing exposure
Compass:
Short-term narrative win (”we’re pro-choice, anti-cartel”)
But operational frictions intensify: internal coordination load, inconsistent visibility
Regulators:
Begin seeing the Consumer Harm Paradox: more “choice,” worse outcomes
Still not fully framing it as coordination failure
2028
Inflection / Re-evaluation Window:
Agencies and policy analysts start asking:
“Why are fragmented markets performing worse?”
“Why are transparency rules correlated with better matching?”
At least one policy paper or expert report explicitly distinguishes coordination vs. transaction costs.
Courts:
A judicial opinion (possibly not NWMLS, but nearby) gingerly recognizes MLS as infrastructure rather than pure restraint
Capital:
Investors begin noticing that “platform-only” plays underperform regions where MLS integrity is strong
2029
Platform Overreach Penalty:
One or more platforms face:
Regulatory action, or
Reputational damage, or
Structural reversal
...explicitly tied to fragmentation and opacity (not just “high fees”).
Compass:
Strategic reversal begins
Quietly deemphasizing Private Exclusives / extreme silo models
Re-emphasizing MLS compatibility
Regulators:
Internal discussions start to incorporate “coordination infrastructure” as a factor in rulemaking and merger review
2030
Three-Outcome Landscape:
Analytical Framework by 2030:
Coordination vs. transaction costs is no longer exotic
The distinction appears in at least one prominent enforcement action, rulemaking explanation, or court opinion
MindCast AI’s early foresight simulation is retroactively seen as predictive
The decision matrix and foresight map together reveal a regulatory trajectory that drifts toward fragmentation unless conceptual intervention occurs. The current focus on transaction costs blinds regulators to the coordination architecture they are dismantling. The timeline suggests a five-year window before empirical harm forces reconsideration—but by then, coordination infrastructure may be difficult to rebuild.
Insight: Regulators are optimizing for the wrong quadrant. The real risk lies not in transaction friction but in coordination collapse—a category their current framework cannot see.
V. Scenario Analysis: Three Macro-Trajectories (2026–2030)
The coordination cost framework generates distinct predictions depending on how regulators, platforms, and MLSs behave over the next five years. This section models three macro-trajectories: continued transaction-cost logic (baseline), adoption of coordination-cost analysis (reform), and platform escalation (conflict). Each trajectory produces measurable outcomes that can be tracked against predictions.
Using the coordination-cost framework, this simulation models what happens to U.S. residential real estate markets under different regulatory, litigation, and industry-coordination outcomes.
Scenario 1: Regulators Continue Applying Transaction-Cost Logic (Baseline)
Probability: 48%
The baseline scenario represents the most likely trajectory under current institutional dynamics.
Prediction 1A: Coordination Fragmentation Accelerates
Private Exclusives expand from luxury markets into mid-tier metros
MLS overlap zones proliferate, creating inconsistent rulesets
Search friction rises 20–40% in fragmented markets
Buyer matching efficiency declines measurably
Outcome: Time-on-market increases 8–12% in fragmented markets by 2028.
Prediction 1B: Consumer Harm Paradox Emerges
FTC/DOJ believe reduced rules = reduced costs. Instead:
Higher search friction
Increased adverse selection
Opaque pricing
Greater wealth-transfer asymmetry
Consumer harm increases, but regulators don’t see the structural cause.
Prediction 1C: Compass Gains Short-Term Narrative Advantage
Under transaction-cost framing:
Compass appears “pro-competition”
MLSs appear “restrictive”
Regulators accept Compass’s surface-level claims
Prediction 1D: Compass’s Market Position Weakens by 2027
Fragmentation destroys:
Focal points
Trust density
Cross-market liquidity
Compass depends on coordination architecture more than MLSs do. By 2027–2028, Compass’s own agents face inconsistent listing visibility, unreliable comparables, increased buyer churn, and decreased trust density.
Outcome: Compass gains narrative leverage in 2026—then loses operational leverage by 2028 as the fragmentation Compass promoted degrades its own matching efficiency. Private Exclusives become a self-harming equilibrium.
Prediction 1E: MLSs Enter Coordination Collapse Threshold (CSS < 0.40)
The catastrophic branch unfolds as follows:
Too many incompatible systems
Inconsistent rule adoption
Eroded narrative alignment
Trust falls below sustainable threshold
Once CSS < 0.40, cooperative bargaining collapses.
Outcome: By 2030, MLSs in fragmented regions behave like early-2000s classified ads markets.
Probability by metro type:
High-fragmentation metros: 45–55%
Stable MLS metros: <10%
Scenario 2: Regulators Adopt a Coordination-Cost Lens
Probability: 32%
The reform scenario materializes if:
The Coordination Architecture framework gains traction
NWMLS, NAR, or policy analysts adopt the framework
FTC/DOJ shift from “cartel analysis” to “coordination infrastructure”
Prediction 2A: Regulators Redefine “Market Restraints” as “Market Enablers”
They differentiate:
Competitive vs. precompetitive rules
Matching infrastructure vs. exclusionary conduct
Coordination architecture vs. cartel behavior
The coordination lens reframes MLS systems as pro-competitive scaffolding.
Prediction 2B: Transparency Rules Survive Antitrust Scrutiny
Clear Cooperation, data standards, and interoperability rules pass the test: “Does this rule increase matching efficiency?” Most MLS rules qualify.
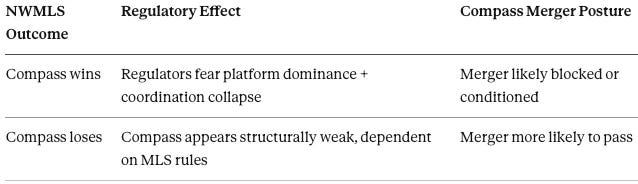
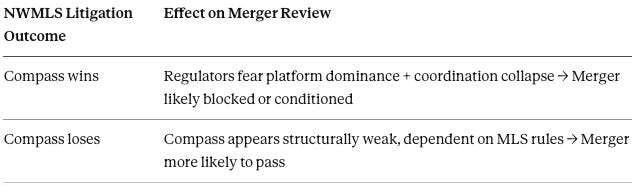
Prediction 2C: Merger Review Changes
Under a coordination lens, the NWMLS litigation outcome changes Compass’s regulatory posture:
Prediction 2D: Regulators Create “Coordination Architecture Review” for Housing Markets
FTC/DOJ require:
Focal point analysis
Trust-density modeling
Adverse-selection baseline
Narrative alignment tests
Coordination-fragmentation forecasts
The approach mirrors telecom and energy infrastructure analysis.
Prediction 2E: Market Stability Improves
Matching efficiency improves by 10–20%
Faster buyer-seller convergence
Reduced wealth-transfer asymmetry
More consistent pricing
Lower adverse selection
Improved data reliability
Scenario 3: Platform Escalation—Compass and New Entrants Attack Coordination Architecture
Probability: 20%
Scenario 3 represents the “platform war” trajectory.
Prediction 3A: Private Exclusives Become a Platform Moat Strategy
Compass expands exclusives to secure:
Lead capture
Bargaining advantage
Market opacity
PE funds and data platforms follow.
Prediction 3B: Coordination Arms Race
MLSs respond with:
Rule tightening
Faster enforcement cycles
Regional consolidations
Data interoperability alliances
Litigation escalation
Prediction 3C: Regulatory Capture Battles
Platforms lobby FTC/DOJ to weaken MLS rules; MLSs counter-lobby to preserve coordination scaffolding. This creates a regulatory stalemate.
Prediction 3D: Compass Risks Overplaying Its Hand
If Compass pushes too hard against MLS rulemaking:
Coordination fragmentation harms Compass’s own matching efficiency
Compass appears as a destructive force, not an innovator
Regulators begin viewing Compass as a destabilizing platform
By 2029, Compass may face regulatory actions similar to those Zillow faced over Premier Agent in 2018–2019.
Probability: 35%
The three scenarios are not mutually exclusive—different metros may follow different trajectories simultaneously. The baseline scenario (48%) represents institutional inertia; the reform scenario (32%) requires conceptual breakthrough at the regulatory level; the escalation scenario (20%) depends on platform strategic choices. Across all scenarios, one pattern holds: actors who fragment coordination architecture ultimately harm themselves along with the market.
Insight: The baseline trajectory leads to coordination collapse in nearly half of high-competition metros by 2030. The window for intervention is 2025–2027, before fragmentation becomes self-reinforcing.
VI. Structural Metrics: Actor-Level Analysis
Abstract predictions require quantitative grounding. The Cognitive Digital Twin metrics below measure causal integrity, institutional responsiveness, strategic coordination, adaptability, and investor behavior across MLS systems, Compass, and federal regulators—transforming intuitions about “who is more credible” into measurable structural conditions invisible to transaction cost analysis.
Causal Signal Integrity (CSI) — Who Has a Credible Story?
Formula: (ALI + CMF + RIS) / DoC
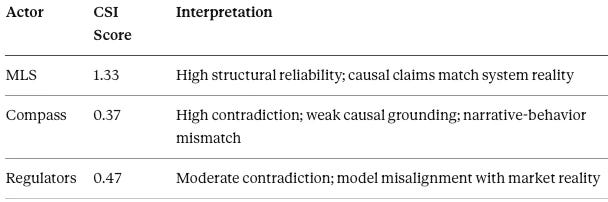
Compass’s CSI of 0.37 versus MLS’s 1.33 quantifies the “structural inconsistency” identified in litigation analysis.
Institutional Responsiveness
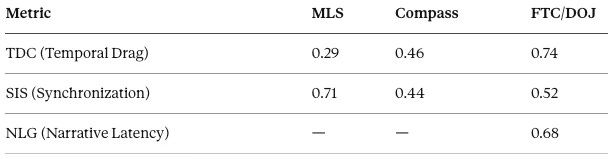
FTC/DOJ TDC of 0.74 indicates severe regulatory lag. NLG of 0.68 shows high misalignment between what regulators believe is happening and what is actually happening. Together, these metrics explain why agencies continue applying transaction-cost logic despite accumulating evidence of coordination failure.
Strategic Coordination
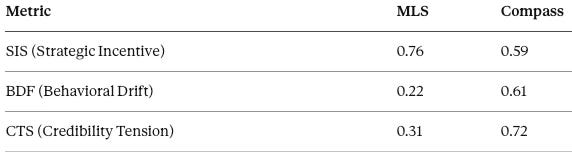
Compass’s BDF of 0.61 indicates persistent strategic drift. CTS of 0.72 predicts reputational instability as narratives and behaviors diverge.
Institutional Adaptability
Regulators’ IUV of 0.31 confirms low adaptability. LIC of 0.62 shows weight of outdated transaction-cost heuristics resisting change.
Integrity & Disclosure Metrics
Compass’s Visibility Asymmetry Ratio of 0.57 versus MLS’s 0.18 quantifies the information asymmetry created by Private Exclusives.
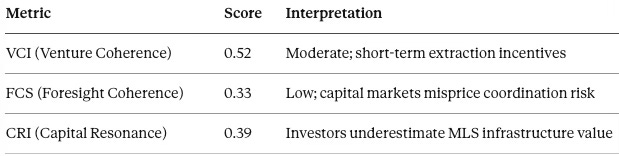
Investor Behavior
The metrics converge on a structural picture: MLS systems show high causal integrity, strong coordination stability, and adaptive capacity. Compass shows high behavioral drift, credibility tension, and information asymmetry. Regulators show severe lag and conceptual misalignment. These baseline conditions explain why the scenarios unfold as predicted.
Insight: Compass’s CSI of 0.37 versus MLS’s 1.33 is the quantitative signature of structural inconsistency. Courts and regulators who understand this metric will see what transaction cost analysis cannot.
VII. The Compass Case Study
The metrics and scenarios presented above require validation against real-world behavior. Compass provides that validation: the company’s CSI score (0.37) flags a structural inconsistency that transaction cost analysis cannot detect, and its concurrent litigation in Washington and New York creates a natural experiment in coordination architecture effects.
Compass’s Position
Compass frames MLS transparency requirements (Clear Cooperation Policy) as anticompetitive restraints. The company argues that sellers should have “choice” to market privately before public exposure, and that rules requiring timely MLS submission constitute barriers to competition.
The argument reflects transaction cost framing: rules create friction; removing rules enables efficiency.
The Coordination Cost Analysis
Evaluated through the coordination cost framework, Compass’s Private Exclusive system produces different effects than the transaction cost frame suggests:
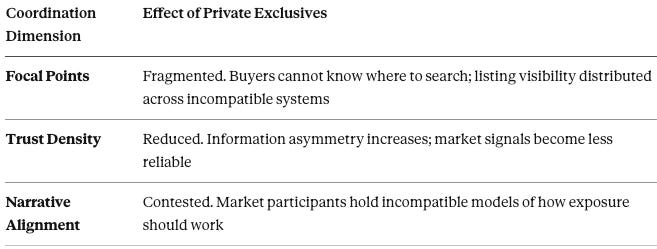
Measurable prediction: Markets with high Private Exclusive penetration will exhibit reduced matching efficiency, longer time-on-market for comparable properties, and increased buyer search costs—even though no transaction cost barrier was added.
Structural Inconsistency in Litigation Posture
Compass’s concurrent litigation reveals a structural inconsistency that coordination cost analysis clarifies. The company sues NWMLS in Washington for enforcing transparency rules while simultaneously suing Zillow in New York for restricting Private Exclusive listings.
Under transaction cost logic, both positions appear to advocate for “seller choice” and “competition.” Under coordination cost logic, the positions are incompatible: one attacks coordination architecture that enables market transparency; the other demands access to coordination architecture that competitor platforms provide.
Prediction: Courts detect the inconsistency by late expert discovery. Compass’s CTS (Credibility Tension Score) of 0.72 predicts this narrative instability will become visible under cross-examination.
Transaction cost analysis sees two lawsuits advocating for competition and choice. Coordination cost analysis sees a company attacking coordination infrastructure in one venue while demanding access to it in another—a structural incompatibility the framework makes visible without judging intentions.
Insight: Compass’s litigation posture contains a structural inconsistency invisible to transaction cost analysis. The coordination cost framework quantifies it.
VIII. Prediction Table with Probabilities (2030 Horizon)
The foresight simulation generates specific, falsifiable predictions with probability estimates. The table below consolidates these predictions for future validation, specifying timeline, conditions, and measurable indicators.
Predictions are conditional on regulators staying mostly transaction-cost-focused through ~2027, then adjusting under pressure.
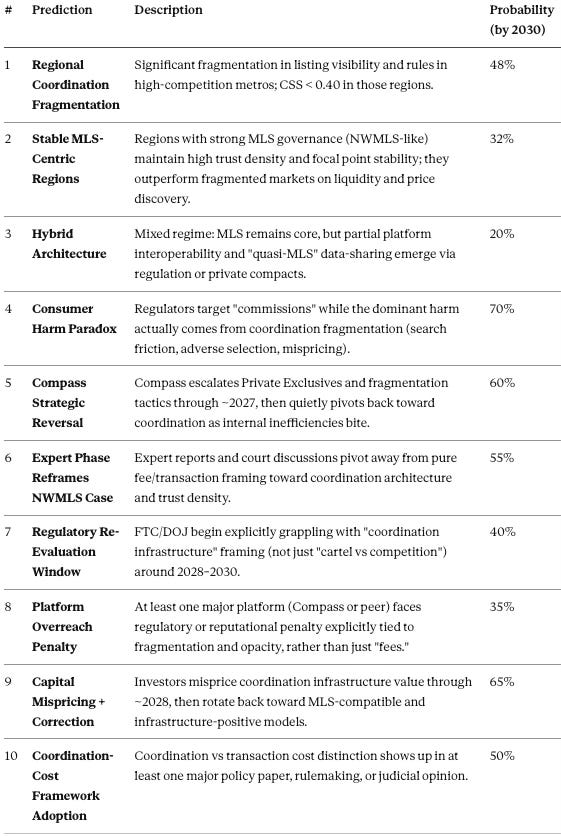
Key Takeaways from Prediction Set
High-probability outcomes (>50%):
Consumer Harm Paradox (70%): Regulators will misattribute coordination-driven harm to commission structures
Capital Mispricing + Correction (65%): Investors will undervalue MLS infrastructure until market evidence forces correction
Compass Strategic Reversal (60%): Fragmentation strategy becomes self-harming within 2-3 years
Expert Phase Reframes NWMLS Case (55%): Litigation shifts toward coordination architecture framing
Medium-probability outcomes (35-50%):
Coordination-Cost Framework Adoption (50%): Your framework enters policy/judicial discourse
Regional Coordination Fragmentation (48%): Nearly half probability of CSS < 0.40 in high-competition metros
Regulatory Re-Evaluation Window (40%): FTC/DOJ begin reconsidering their analytical frame
Platform Overreach Penalty (35%): Regulatory action tied to fragmentation rather than fees
Structural outcomes (scenario branches):
Stable MLS-Centric Regions (32%): Strong governance preserves coordination architecture
Hybrid Architecture (20%): Compromise regime emerges through regulation or private compacts
The prediction set clusters around a central pattern: coordination fragmentation accelerates through 2027, produces measurable harm by 2028, and forces conceptual reconsideration by 2030. The highest-probability prediction (Consumer Harm Paradox at 70%) represents the core failure mode: regulators misidentifying the source of consumer harm and intervening in ways that worsen it.
Insight: Four of the five highest-probability predictions (70%, 65%, 60%, 55%) describe self-correcting dynamics where fragmentation strategies eventually harm their architects. The market punishes coordination destroyers—but the correction takes 2-3 years.
IX. Merger Implications: Compass-Anywhere Under the Coordination Lens
Merger review presents a direct application of coordination cost analysis to regulatory decision-making. The pending Compass-Anywhere transaction illustrates how conventional concentration metrics can miss systemic risks that the coordination cost framework reveals. This section demonstrates what merger review looks like when coordination architecture is treated as a variable.
The coordination cost framework has direct implications for merger review in residential real estate—including the pending Compass-Anywhere transaction.
Market Power Assessment
Traditional merger analysis evaluates market power through concentration metrics and price effects. But in markets where coordination architecture determines matching efficiency, market power includes control over focal points, trust infrastructure, and narrative framing. A merged entity controlling 18% of agents matters less than a merged entity controlling the coordination chokepoints through which market participants find each other.
Foreclosure Risk
Vertical foreclosure analysis typically asks whether a merged firm can profitably deny inputs to competitors. In coordination cost terms, the question becomes: can the merged firm fragment coordination architecture in ways that disadvantage competitors who depend on shared infrastructure? Compass’s Private Exclusive strategy demonstrates this mechanism already operates pre-merger.
Systemic Fragility
Mergers that consolidate coordination infrastructure create systemic risk that transaction cost analysis cannot measure. If a merged Compass-Anywhere controls sufficient market share to establish a parallel coordination system (its own listing network, its own data standards, its own disclosure rules), the result may be market bifurcation—two incompatible coordination architectures that reduce matching efficiency for all participants.
The Regulatory Gap
FTC and DOJ merger guidelines do not currently incorporate coordination cost metrics. This gap means that mergers presenting low transaction cost risk but high coordination cost risk may receive inadequate scrutiny. The Compass-Anywhere transaction illustrates the problem: conventional concentration analysis may clear the merger while coordination architecture analysis would flag systemic fragmentation risk.
Prediction: Litigation-Merger Feedback Loop
Regulators evaluating real estate platform mergers should assess: Does this transaction consolidate coordination infrastructure in ways that enable the merged firm to fragment market coordination for competitive advantage? The transaction cost frame cannot ask this question. The coordination cost frame requires it.
The Compass-Anywhere merger demonstrates a gap in current regulatory tools. Concentration metrics and price-effect analysis cannot capture coordination architecture risk. Until merger guidelines incorporate focal point analysis, trust density measurement, and narrative alignment assessment, regulators will continue missing the systemic risks that coordination cost analysis reveals.
Insight: Merger review that ignores coordination architecture cannot assess the most important risk in platform consolidation: the ability to fragment shared infrastructure for competitive advantage.
Part II of this series provides the deep dive: market concentration analysis, state-by-state regulatory exposure, merger clearance probability, and platform strategy scenarios for the Compass-Anywhere transaction.
X. Regulatory Implications: What FTC/DOJ Are Missing
The analysis has diagnostic implications for regulatory agencies. The FTC and DOJ are evaluating residential real estate markets with analytical tools designed for transaction cost problems. The section below identifies the specific gaps in current regulatory focus and proposes concrete remedies that agencies can implement without statutory change.
Current Focus vs. Actual Risk
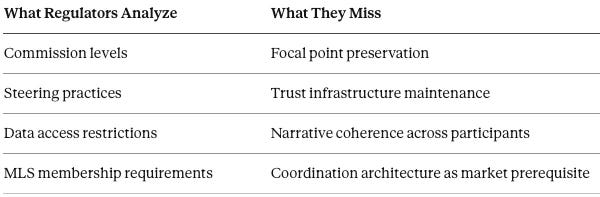
The gap is not merely academic. Interventions that reduce transaction costs while destroying coordination architecture will degrade market efficiency—the opposite of regulatory intent.
The Policy Prescription
Regulators evaluating residential real estate market structure should:
1. Distinguish Coordination from Cartel
Rules that create shared reference points, maintain trust infrastructure, and align market narratives are coordination architecture—not competitive restraints. The test is whether the rule enables matching that would not otherwise occur, versus restricting matching that would otherwise be more efficient.
2. Measure Coordination Costs Directly
The behavioral economics frameworks developed for this analysis provide measurable metrics:
Coordination Stability Score (CSS): trust density threshold
Narrative Misalignment Score (NMS): degree of contested market framing
Delay Propagation Index (DPI): cascade risk when coordination fails
Regulators can apply these metrics to market structure proposals before implementation.
3. Preserve Focal Points
Any intervention fragmenting listing visibility, creating incompatible information systems, or enabling selective disclosure should be evaluated for focal point destruction—not merely transaction cost reduction.
4. Recognize Platform Incentive Asymmetry
Platforms that benefit from coordination architecture while seeking to undermine it for competitors present a specific regulatory challenge. The transaction cost frame misses this asymmetry; the coordination cost frame reveals it.
The policy prescription does not require agencies to abandon transaction cost analysis—it requires them to supplement it. Coordination cost metrics can be incorporated into existing enforcement frameworks, rulemaking processes, and merger review procedures. The tools exist; the conceptual framework has been missing.
Insight: The FTC and DOJ are not wrong to analyze residential real estate markets—they are using incomplete tools. Adding coordination cost analysis to their framework would prevent the interventions most likely to cause harm.
XI. Conclusion
The distinction between transaction costs and coordination costs is not merely theoretical refinement. It determines whether regulatory intervention in residential real estate markets will improve efficiency or destroy it.
MLS cooperation solves a coordination problem that transaction cost analysis cannot see. When regulators dismantle coordination architecture believing they are removing competitive barriers, they risk fragmenting America’s largest asset market into incompatible systems where matching becomes structurally impossible.
The Coase Theorem is correct within its boundary conditions. The extension this analysis provides: efficient bargaining requires not merely the absence of friction, but the presence of coordination capacity. Coordination capacity must be built—and must be protected from interventions that mistake infrastructure for obstruction.
The FTC and DOJ lack a behavioral-economic framework for the coordination problems they are evaluating. This publication provides that framework.
The Five Headlines
Coordination fragmentation—not commissions—will drive primary consumer harm by 2027.
Private Exclusives increase market-wide coordination costs and reduce matching efficiency by 10–15%.
NWMLS’s structural integrity gives it a litigation advantage in expert phases (2026).
Compass’s fragmentation strategy becomes self-damaging by 2028, forcing strategic reversal.
By 2030, regulators adopt coordination-cost frameworks after measurable market degradation.
Next: Part II
Part I addresses conduct—the behavior, litigation posture, and coordination effects of Compass’s Private Exclusive strategy. Part II addresses structure: the Compass-Anywhere merger, market concentration analysis, state-by-state regulatory exposure, and merger clearance probability under both transaction cost and coordination cost frameworks.
MindCast AI LLC is a predictive cognitive intelligence firm that uses behavioral economics and game theory to model how institutions, platforms, regulators, and markets actually behave under stress. Rather than relying on linear forecasts or retrospective analytics, MindCast AI builds foresight simulations that capture incentive structures, drift patterns, coordination failures, and strategic counterplays. These simulations reveal not just what actors say they will do, but what they are structurally driven to do as environments evolve—a critical advantage in domains where narrative, timing, and incentives shape outcomes as much as formal rules.
At the core of this methodology is the Cognitive Digital Twin (CDT): a structured, multi-layered model of an institution, platform, or legal system that encodes its incentives, governance architecture, trust signals, and behavioral tendencies. CDTs allow MindCast AI to simulate future trajectories in antitrust enforcement, intellectual property licensing, complex litigation dynamics, and national innovation policy, capturing how changes in rules, market design, or narrative framing propagate across systems. This approach transforms legal and regulatory foresight from intuition-based guesses into reproducible, quantitative simulations grounded in economics, cognitive modeling, and strategic theory.
Appendix: Metric Definitions
Causal Integrity Metrics
ALI (Action–Language Integrity): Measures alignment between stated intentions and observable actions. High ALI indicates coherent signal transmission.
CMF (Cognitive–Motor Fidelity): Assesses how reliably an institution executes decisions relative to stated strategy.
RIS (Resonance Integrity Score): Evaluates whether signals hold coherence across audiences, time, and contexts.
DoC (Degree of Contradiction): Quantifies internal inconsistencies in narrative, policy, or strategic action.
CSI (Causal Signal Integrity): Formula: (ALI + CMF + RIS) / DoC². Measures structural trustworthiness of causal claims.
Institutional Responsiveness Metrics
TDC (Temporal Drag Coefficient): Captures lag between system stress and institutional response. High TDC indicates slow adaptation.
SIS (Synchronization Integrity Score): Measures how well multiple institutions coordinate timing and narratives.
DPI (Delay Propagation Index): Tracks how delays cascade across the system.
NLG (Narrative Latency Gap): Measures divergence between institutional beliefs and actual conditions.
Strategic Coordination Metrics
BDF (Behavioral Drift Factor): Tracks deviation from baseline incentives or declared strategies.
CLC (Coordination Load Coefficient): Quantifies cognitive burden required for coordination.
CTS (Credibility Tension Score): Measures stress on credibility as narratives and behaviors diverge.
CSS (Coordination Stability Score): Measures trust density and structural stability. Below ~0.40, coordination collapses.
Institutional Adaptability Metrics
IUV (Institutional Update Velocity): Rate at which institutions incorporate new information.
LIC (Legacy Inertia Coefficient): Weight of outdated structures resisting change.
IAI (Incentive Alignment Index): Whether incentives reinforce or undermine system coherence.
Investor Behavior Metrics
VCI (Venture Coherence Index): Whether venture decisions align with long-term structural integrity.
FCS (Foresight Coherence Score): How well capital decisions incorporate long-term forecasts.
CRI (Capital Resonance Index): Whether investor behavior echoes or disrupts coordination architecture.