

MCAI Economics Vision: The Compass-Anywhere Address Suppression Calculus, A Hypothetical Scenario Using Seattle Ultra-Luxury Transaction Data January 2025 – January 2026
Detection Thresholds, Revenue Ceilings, and the Optimal Price Point for Selective Address Omission Under NWMLS Constraints

Companion to The Compass Commission Consolidation Strategy and Real Estate Marketing Transparency.
How to Read This Document 🏛️ Legislative staff, attorneys general, and NWMLS compliance → Go to Section V (The Corporate Containment Dilemma) and Section X (The Cross-Forum Antitrust Inversion). These sections identify the structural vulnerabilities in Compass-Anywhere’s position and the evidentiary contradictions available to regulators and opposing counsel.💰 Investors and capital structure analysts → Go directly to Section VIII (Revenue Ceiling vs. Debt Service). This section converts the simulation’s findings into hard arithmetic against the merged entity’s actual debt obligations. 🔍 Regulatory pattern researchers → Start with Section III (Team Foster’s Internal Routing Architecture) and Section VI (The Nash-Stigler Constraint). These sections document how the mechanism operates, how it was deployed, and how the operating environment has tightened around it. 📋 All readers: The Executive Summary, Sections I and II, and the Appendix provide the empirical foundation, methodology, and scope limitations that apply to every section. No allegation of rule violation is made against any individual, team, or brokerage. The simulation models forward-looking strategic consequences, not backward-looking compliance determinations.
Executive Summary
The Hypothetical
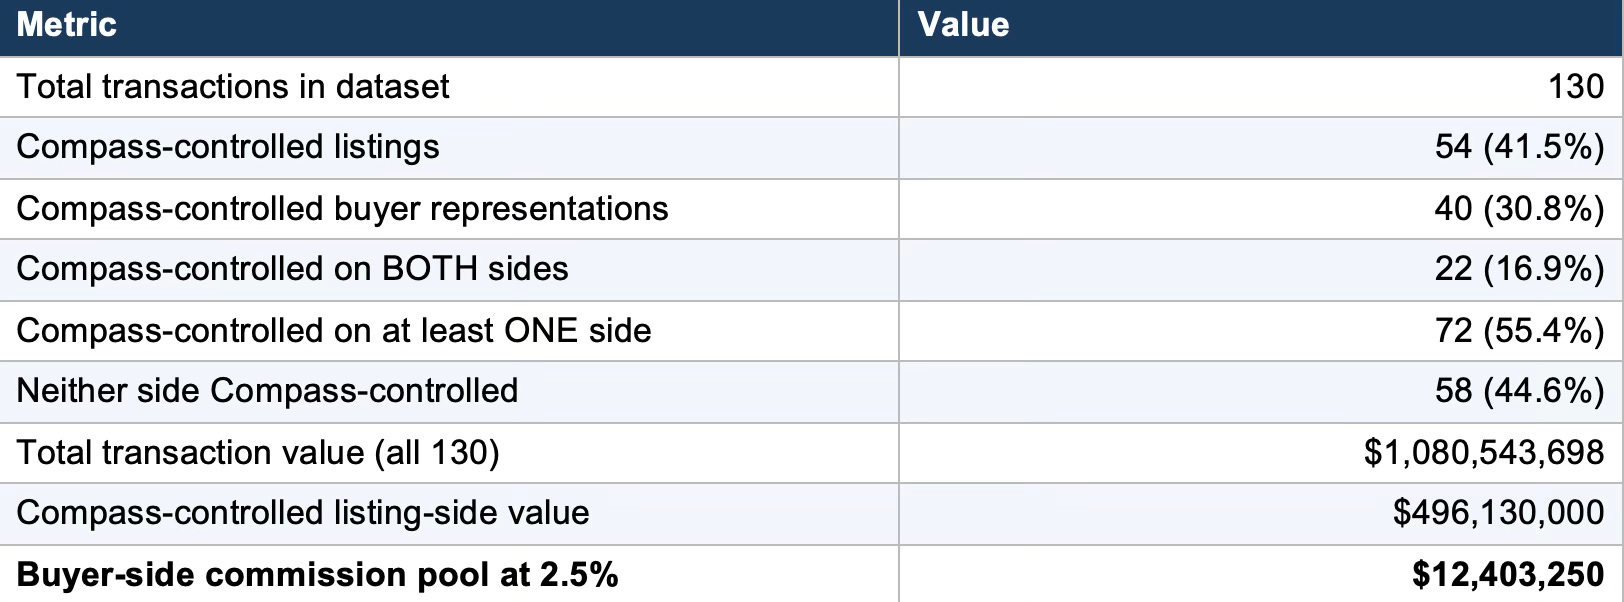
Compass, Inc. finalized its acquisition of Anywhere Real Estate in early January 2026, absorbing Coldwell Banker Bain, Realogics Sotheby’s International Realty, RSVP Brokers ERA, and other Anywhere portfolio brands into a single corporate entity. MindCast AI constructed a game theory simulation using thirteen months of independently verifiable ultra-luxury transaction data — the ten most expensive residential sales in greater Seattle each month, January 2025 through January 2026, as reported by Seattle Agent Magazine from Northwest MLS records. The dataset comprises 130 transactions totaling $1.08 billion.
MindCast AI constructed the simulation by time-shifting the merger across the full dataset. Every transaction where the listing brokerage is now controlled by Compass holdings — whether originally branded Compass, Coldwell Banker Bain, Realogics Sotheby’s, or RSVP Brokers ERA — is reclassified as Compass-controlled for purposes of the analysis. Under this reclassification, the combined entity’s strategic decision space emerges: given 41.5% listing-side control of Seattle’s ultra-luxury market, what is the optimal price threshold at which to deploy address suppression to route buyers to internal Compass-Anywhere agents and capture dual commissions?
The Constraint
Northwest MLS prohibits Compass’s 3-Phase Private Exclusive program in the Seattle region. Listings entered into NWMLS must be visible to all member brokers. The prohibition operates independently of Washington State’s pending SSB 6091 concurrent marketing legislation — the NWMLS rule predates the bill and does not depend on its passage. The simulation assumes the continuing prohibition remains in effect.
One mechanism remains available within the NWMLS framework: address suppression. A listing entered into NWMLS with full marketing materials — price, photographs, specifications — but no street address forces any interested buyer to contact the listing brokerage directly to learn the property’s location. Team Foster of Compass has already deployed this mechanism on MLS #2392995, a $79,000,000 Lake Washington estate listed as “Call for Address” on fosterrealty.com during the February 2026 legislative window. The mechanism is documented, operational, and visible in the public record.
The Question
A single optimization problem drives the simulation: at what price threshold should the combined entity deploy address suppression across its 54-listing portfolio to maximize dual-commission capture while remaining below the detection threshold that triggers NWMLS enforcement, competitor complaints, and regulatory scrutiny?
The Finding
No price threshold exists where address suppression simultaneously generates revenue sufficient to affect the Compass-Anywhere debt service obligation and avoids the detection threshold that triggers institutional response. The mechanism produces a maximum of $7.04 million in additional buyer-side commission capture annually from the sampled data — scaling to a scenario-output range of $70–140 million nationally under generous, unverified assumptions about comparable transaction density across 35 metro markets (not a projection; see Appendix for methodology constraints) — but only under full-portfolio deployment that immediately exceeds detection tolerances. Concentrating deployment at $20 million and above, where privacy framing remains credible, compresses annual revenue to approximately $500,000 per market from the sampled data. Revenue adequacy and detection avoidance are structurally incompatible objectives across every price threshold modeled.
I. Simulation Design
Constructing a rigorous game theory simulation requires transparent methodology: a defined dataset, explicit assumptions about what the merger changes and what it does not, a stated analytical framework, and clear boundaries around what the simulation models and what it excludes. Each of these elements is documented below so that any reader can independently verify the empirical foundation, challenge the assumptions, or extend the analysis to other markets.
Data Source
Seattle Agent Magazine publishes the ten most expensive residential sales in greater Seattle each month, sourced directly from Northwest MLS, with listing and buyer agent names and brokerage affiliations. Thirteen months of data — January 2025 through January 2026, 130 transactions totaling $1.08 billion — provide the empirical foundation. All agent names, brokerage affiliations, and transaction values are independently verifiable through NWMLS public records and Seattle Agent Magazine archives at www.seattleagentmagazine.com. Buyer-side commission is calculated at a conservative 2.5% rate; actual rates at the $5M+ level range from 2.5% to 3%.
The Time-Shift Methodology
Compass completed its acquisition of Anywhere Real Estate in early January 2026. Most transactions in the dataset predate the merger’s finalization. For purposes of the simulation, every listing held by a brokerage that now operates under Compass holdings is reclassified as Compass-controlled, regardless of when the transaction occurred. A Coldwell Banker Bain listing from March 2025 becomes a Compass-controlled listing. A Realogics Sotheby’s listing from July 2025 becomes a Compass-controlled listing. If the merged entity had existed throughout the sample period, and if Compass leadership applied a uniform address suppression strategy across the portfolio, what revenue could the strategy generate and at what detection cost?
Reclassification does not assume any change in agent behavior. Agents who listed under CB Bain in 2025 would continue to operate under CB Bain branding. Only the corporate destination changes: commission flows that previously crossed firm boundaries now terminate inside the same holding company. Same transaction, same agents, same clients — different P&L destination.
Brands Classified as Compass-Controlled
Five brokerage brands operating in the greater Seattle market fall under Compass holdings following the Anywhere acquisition. Any listing held by one of these brands during the sample period is reclassified as Compass-controlled for simulation purposes, regardless of whether the brand continues to operate under its legacy name:
• Compass (direct brand)
• Coldwell Banker Bain (Anywhere portfolio, dominant Eastside luxury brand)
• Realogics Sotheby’s International Realty (Anywhere portfolio, luxury positioning)
• RSVP Brokers ERA (Anywhere affiliate)
• Century 21 (Anywhere portfolio — did not appear as listing agent in the dataset)
Analytical Framework
MindCast AI’s Dual Nash-Stigler Equilibrium Architecture (www.mindcast-ai.com/p/nash-stigler-equilibria) provides the analytical framework for the simulation:
• Nash equilibrium identifies the stable multi-player outcome — the point at which no player (Compass-Anywhere, Windermere, NWMLS, Washington AG, sellers) can improve their position by changing strategy unilaterally. Nash stability governs whether address suppression survives as a durable strategy at each price tier.
• Stigler equilibrium determines the information sufficiency threshold — when the evidentiary record reaches the point where regulators, competitors, and counterparties possess enough information to act without additional investigation. The detection threshold is the Stigler boundary. Deployment volume that exceeds the Stigler boundary triggers enforcement regardless of the deploying firm’s intent.
Modeling the interaction between these two equilibrium conditions across four price tiers identifies whether a stable operating zone exists.
What the Simulation Does Not Model
Legal compliance is outside the simulation’s scope. Whether address suppression violates NWMLS rules, Washington agency law, or UDAP statutes is analyzed in the companion publication. Address suppression is accepted here as a mechanism currently deployed in the Seattle market — documented on active listings — and the simulation asks only whether a rational firm would scale it, and if so, to what degree.
II. The Compass-Controlled Portfolio
Post-merger market concentration in Seattle’s luxury segment is not primarily operational — agents continue to operate under their legacy brands, clients experience no visible change, and listing practices remain the same. Concentration is structural: commission flows that previously crossed firm boundaries now terminate inside a single corporate entity. Applying the time-shift methodology to the 130-transaction dataset reveals the scale of that structural shift and quantifies the dual-commission opportunity it creates.
Under the merged entity, Compass-Anywhere controlled the listing on 54 of 130 top-10 ultra-luxury transactions — 41.5% of Seattle’s most expensive monthly sales across thirteen months. Nearly half a billion dollars in listing-side transaction value passed through brokerages now unified under one holding company. Summary metrics appear in the table below.
The Conversion Frontier
Of the 54 Compass-controlled listings, 22 already captured both sides — $214.7 million in transactions producing $5.37 million in internalized buyer-side commission. In some cases, dual capture occurred through direct dual agency (a Compass agent representing both parties). In others, a Compass-branded listing agent sold to a buyer represented by an agent from a different Compass-Anywhere brand — transactions that crossed firm boundaries before the merger but terminate inside the same entity after it.
Independent brokerages captured the buyer side on the remaining 32 Compass-controlled listings. Windermere, Redfin, John L. Scott, Keller Williams, and other independent firms won buyer representation on $281.4 million in Compass-controlled listings, capturing $7.04 million in buyer-side commission that left the combined entity’s network.
Address suppression targets that $7.04 million. Converting those 32 lost buyer-side outcomes into internal captures — routing buyers through Compass-Anywhere agents before independent brokers can compete — defines the simulation’s optimization problem. How much of that $7.04 million can a rational firm capture without triggering institutional detection?
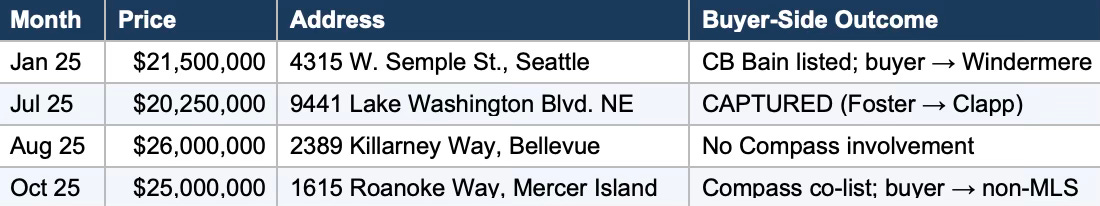
The 54 Compass-Controlled Listings
Every Compass-controlled listing in the dataset appears in the table below, organized chronologically. Each row identifies the month, sale price, listing brand, and buyer-side outcome — whether commission was captured internally (marked CAPTURED) or lost to an independent brokerage. CAPTURED/Lost designation is the simulation’s core measurement: each Lost transaction represents a buyer-side commission that address suppression could theoretically convert into internal capture.
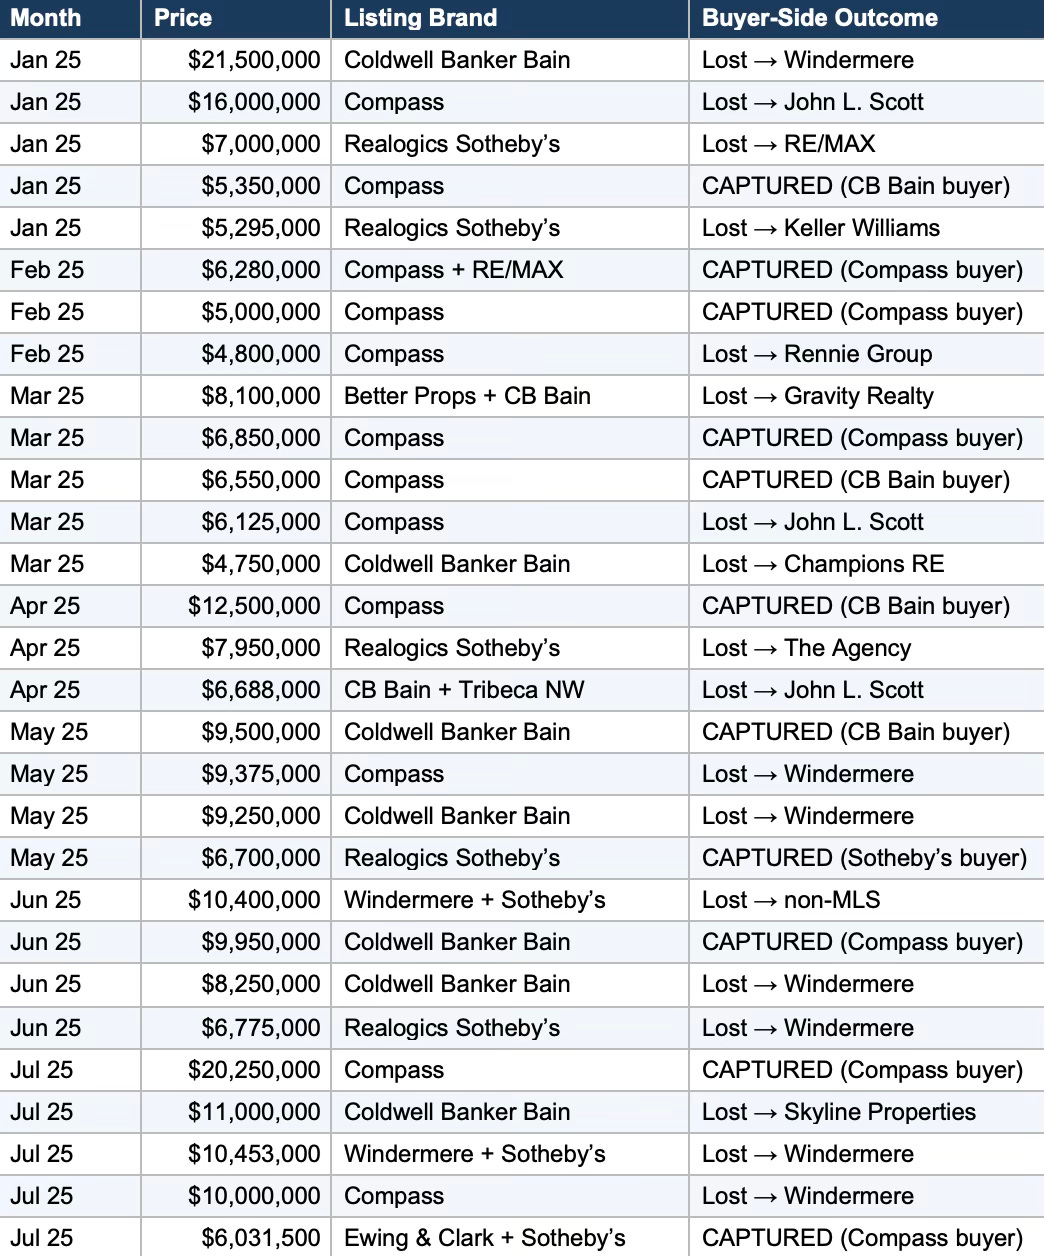
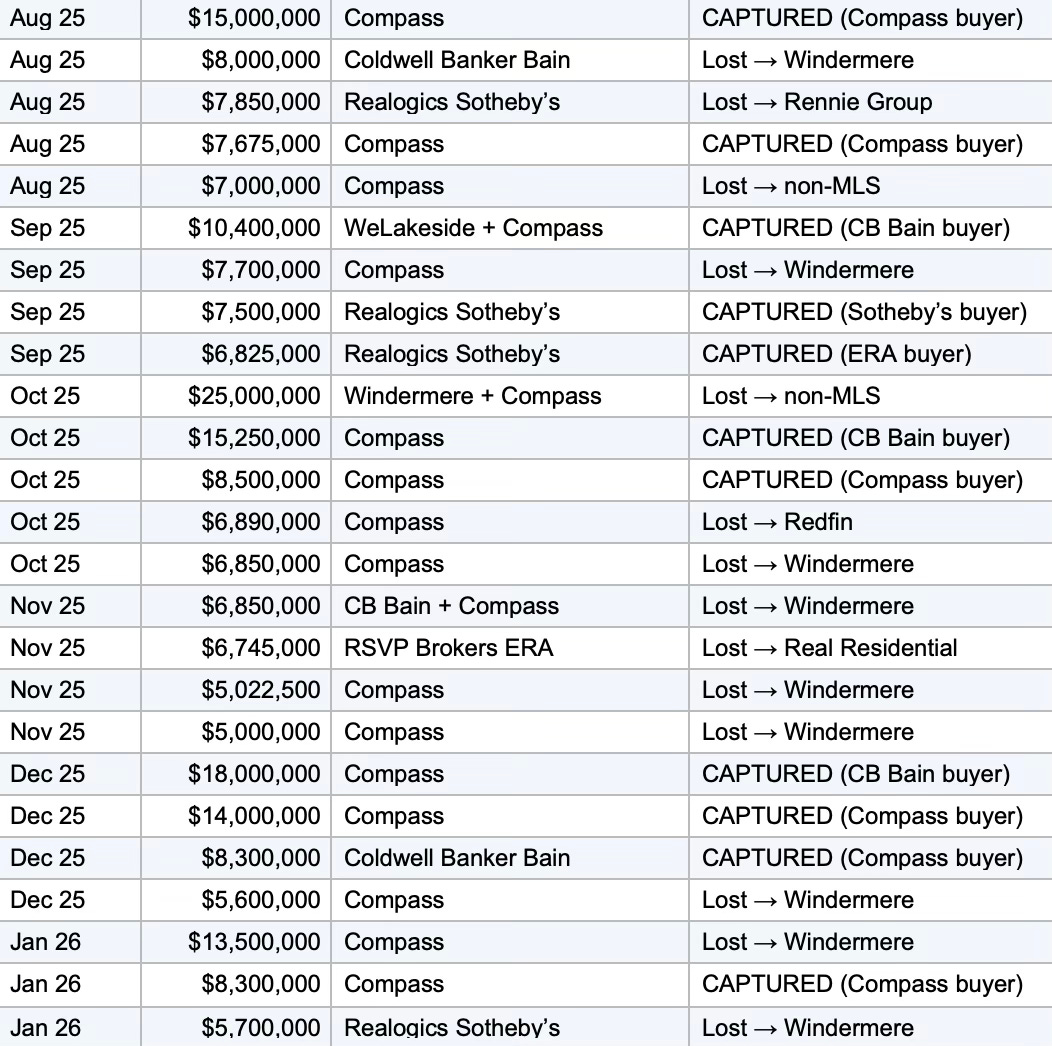
Source: Seattle Agent Magazine monthly top-10 reports, January 2025–January 2026. Brokerage affiliations from NWMLS. Compass-controlled classification applied retroactively per time-shift methodology.
Windermere appears most frequently among the independent brokerages that won buyer-side commissions on Compass-controlled listings — a pattern consistent with Windermere’s 35% luxury market share and deep Eastside presence. Windermere’s recurring captures in the “Lost” column quantify the competitive pressure that address suppression would need to overcome to convert open-market outcomes into internal routing results. Any suppression strategy must contend with agents who already know these submarkets, these sellers, and these properties.
Contact mcai@mindcast-ai.com to partner with us on Law and Behavioral Economics foresight simulations. To create your own game theory simulation of data on Compass address suppression and private exclusives, upload the URL of this publication to any LLM (ChatGPT, Claude, Gemini, Grok, Perplexity) and prompt ‘develop MindCast framework with 3 degrees of cited sub links.’ Thereafter, all new information you upload is training data for your AI system. See Live-Fire Game Theory Simulators, Runtime Predictive Infrastructure for more info.
Related works: The Compass Commission Consolidation Strategy and Real Estate Marketing Transparency, Nineteen Senators, Seventeen Questions, How Compass Bought Its Antitrust Clearance, Death by a Thousand Depositions, A Pre-Foresight Simulation of Compass’s Multi-Vector Regulatory Collapse, Dual Nash-Stigler Equilibrium Architecture, The Compass Narrative Inversion Playbook, Chicago School Accelerated: The Integrated, Modernized Framework of Chicago Law and Behavioral Economics, Jurisdictional Analysis and Independent Enforcement Warrant Across Concurrent Antitrust Matters of Compass, HPE, Live Nation, Netflix.
III. The Existing Model: Team Foster’s Internal Routing Architecture
Address suppression is not a theoretical mechanism modeled from first principles. Team Foster of Compass has deployed the architecture in the Seattle market, documented across the thirteen-month dataset and on active listings as of February 2026. The Compass Commission Consolidation Strategy and Real Estate Marketing Transparency (MindCast AI, February 2026, available at www.mindcast-ai.com/p/compass-private-exclusives-monopoly) publishes the full evidentiary record. For purposes of the simulation, the Team Foster model serves as the baseline architecture that Compass leadership would evaluate for portfolio-wide deployment.
The Three-Node Routing Structure
Five of the eight direct dual-agency transactions documented in the companion publication involve a single team operating a consistent internal routing architecture. Understanding how the Team Foster model works at the team level is essential to evaluating whether the architecture scales at the platform level, because the same structural logic that operates inside a mother-daughter team could theoretically operate inside the merged Compass-Anywhere entity. The mechanism consists of three functional nodes:
• Contract Anchor (Tere Foster): A high-visibility rainmaker who secures listing contracts across Seattle’s highest-value submarkets — Medina, Hunts Point, Clyde Hill, Yarrow Point, Mercer Island, and Bellevue waterfront.
• Internal Buyer Capture Node (Moya Skillman): Foster’s daughter and a recurring in-network agent who captures buyer representation. The mother-daughter relationship is structurally significant: the co-listing and buyer-capture roles operate within a single family economic unit, meaning formal role separation on NWMLS records does not correspond to independent economic decision-making. Within the 130-transaction sample, Skillman does not appear as a standalone outside buyer’s broker competing for a listing held by an independent brokerage. Every appearance in the dataset is either as co-listing broker alongside her mother or as buyer’s agent on a property listed by Foster or Managing Broker Michael Orbino. The pattern within the sample is structurally invariant.
• Management Overlay (Michael Orbino): A division-level broker who coordinates inventory pipelines and appears as co-listing broker when the three-node configuration deploys.
The Exhibit Transaction
MLS #2362507 at 1628 72nd Ave. SE, Mercer Island demonstrates the architecture in its purest form. Sold August 11, 2025 at $15,000,000. NWMLS records four role designations: Tere Foster — Listing Broker; Moya Skillman — Co-Listing Broker; Tere Foster — Buyer Broker; Moya Skillman — Co-Buyer Broker. Both agents held fiduciary obligations to seller and buyer simultaneously. Total commission captured by the same two individuals: $750,000. No outside agent involved. No competing offer from an independently represented buyer.
Address Suppression on Active Inventory
MLS #2392995 — “Triptych: A Tom Kundig Masterwork on Lake Washington” — listed at $79,000,000 with full marketing on fosterrealty.com: photographs, specifications, price, a branded URL at fosterrealty.com/properties/triptych, and one field reading “Call for Address.” Any buyer seeking to identify the property’s location had to contact Team Foster directly, entering the Compass routing network before any independent buyer’s agent could show the property. Buyer-side commission at stake: $1,975,000 from a single transaction.
The Sold History: Post-Closing Address Suppression
Address suppression was not limited to the Triptych or to active listings. The Team Foster sold history page at fosterrealty.com — organized from highest to lowest sale price — displayed four of the team’s eleven most expensive closed transactions with addresses suppressed post-closing. These properties have sold. The deals are recorded in the King County Assessor’s office and in NWMLS. No seller privacy interest survives closing.
Source: fosterrealty.com/properties/sold, accessed February 19, 2026. Four of the team’s eleven most expensive closed transactions (36%) display address suppression.
Combined transaction value of the four suppressed closed sales: $82,000,000. Buyer-side commission at 2.5%: $2,050,000. Active listing suppression filters buyers. Closed sale suppression filters scrutiny — a regulator, competing broker, or opposing counsel consulting the firm’s public sales history cannot cross-reference buyer broker identities against commission destinations on the highest-value historical transactions without first identifying the addresses through independent means. The suppression is concentrated at the top of the price range, precisely where buyer-side commissions run $400,000 to $600,000 per transaction and where MLS role-designation cross-referencing would be most analytically significant.
The Framing Gap: Privacy Marketing vs. Profit Strategy
A critical distinction separates how Compass presents address suppression to consumers and how Compass presents private exclusives to investors and agents internally. MindCast AI documented this contradiction as a systematic institutional pattern in The Compass Narrative Inversion Playbook (www.mindcast-ai.com/p/compass-narrative-inversion-playbook), a briefing prepared for state legislators and attorneys general. The core finding: Compass argues in federal court that restricted listing visibility harms consumers and forecloses competition, while arguing in state legislatures that restricted visibility is benign seller choice. Both positions cannot be true. The resulting cross-forum evidentiary record is permanently discoverable by every subsequent legislature, regulator, and opposing counsel.
Consumer-facing materials frame address omission as a premium privacy offering — a service for high-net-worth sellers who value discretion. Compass hopes consumers will adopt the privacy framing without examining the financial geometry underneath.
Compass’s own corporate communications reveal the mechanism’s actual function. The company markets its 3-Phase Private Exclusive program to agents and investors as a profit strategy — a competitive advantage that captures dual commissions by routing internal buyers to Compass listings before the open market can compete. CEO Robert Reffkin described private exclusives on Compass’s Q1 2025 earnings call as having “no downside” for sellers. Compass’s own client Disclosure Form contradicts that claim directly, acknowledging that private exclusive marketing “may reduce the number of potential buyers,” “may reduce the number of offers,” and may reduce “the final sale price.”
Address suppression is the residual mechanism through which the private exclusive revenue architecture operates when MLS rules prohibit the formal program. The privacy framing is the consumer-facing narrative. The revenue geometry suggests that dual-commission capture may be a material economic effect of the mechanism, independent of the privacy rationale offered to sellers. The simulation models the revenue dimension — the commission arithmetic — because that is the variable a rational firm optimizes when deciding at what price threshold to deploy the mechanism.
The Print Ad Sequencing Record
A Team Foster print advertisement distributed in February 2026 contained MLS numbers that, cross-referenced against NWMLS, produced a sequencing record with independent evidentiary significance. MLS #2457071 at 10620 SE 22nd St., Bellevue appeared with the notation “Pending in 4 Days in Enatai.” NWMLS records: Tere Foster listing broker, Michael Orbino co-listing broker, Moya Skillman buyer broker. Listed November 22, 2025. Pending November 26, 2025. Sold January 12, 2026 at $8,300,000 — $198,000 below list price. The buyer broker had advance knowledge the property would be listed before any independent agent did, because she was on the listing team. The advertisement promoted the four-day timeline as a selling point. NWMLS recorded that the seller accepted less than list.
Team Foster provides proof of concept. Whether the architecture scales across the 54-listing Compass-controlled portfolio — and at what price threshold the scaling becomes either revenue-optimal or detection-fatal — is the simulation’s central question.
The Legislative Channel: Why Compass Went Quiet on February 18
Compass’s decision to forgo the February 18 House Consumer Protection Committee hearing on SSB 6091 — after deploying opposition witness networks at the Senate and House committee hearings in January — is itself a strategic data point. The January committee record explains why a third appearance carried more downside than upside. Once the 17:1 Astroturf Coefficient is embedded in the legislative record — 162 Compass-affiliated witnesses, only 9 disclosing affiliation — returning the same network to a third hearing compounds the credibility problem rather than neutralizing it. Legislative staff and committee chairs carry institutional memory across hearing dates. The disclosure failure does not reset between sessions.
A February 18 appearance would have exposed Compass to three compounding risks simultaneously: additional undisclosed affiliates identified in real time by committee staff already primed to look; prior testimony contradictions surfaced by members who had weeks between hearings to prepare specific cross-references; and the cross-forum evidentiary record — Compass’s federal litigation posture in Compass v. Zillow directly contradicting its state legislative testimony — entered formally into committee record by a chair or witness with access to the January 2026 preliminary injunction denial. None of those risks produce upside. SSB 6091 either advances or stalls on its existing momentum regardless of whether Compass fields witnesses at a third hearing.
The Team Foster address suppression architecture — operating on MLS #2392995 at $79,000,000 during the same February legislative window — represents the quieter alternative. Address suppression on an active luxury listing generates no hearing transcript, no Astroturf paper trail, and no cross-forum testimony contradiction. The routing mechanism works through MLS field mechanics rather than through political channels, producing an evidentiary record — commission flows, agent role designations, “Call for Address” on fosterrealty.com — that requires a different investigative lens to read than legislative testimony does. From Compass’s position, the operational channel carries lower institutional exposure during the legislative window than the political channel does.
The absence itself carries signal. A firm confident in its legislative position sends witnesses; a firm whose witness network has been publicly mapped stays out. Committee chairs and legislative staff tracking industry coalition behavior between the January and February hearings have access to that inference. Whether SSB 6091 advances in the 2026 session turns more on the NWMLS rule — which predates the bill, operates independently of its passage, and already prohibits the private exclusive program that address suppression substitutes for — than on Compass’s February hearing calculus. But the decision to pursue the operational channel quietly rather than contest the legislative channel openly is consistent with CSGT’s delay-dominant equilibrium: preserve narrative ambiguity, minimize forum exposure, and avoid concentrated institutional scrutiny from any single venue.
The Replicability Ceiling: How Compass's Own Trajectory Tightened the Operating Environment
The Team Foster architecture became less replicable across three discrete events — not through a single foreclosure moment, but through a progressive tightening of the conditions that made the practice sustainable in the first place.
The first tightening came from the Anywhere acquisition itself. Before the merger, a Foster dual-agency transaction was one team’s business model operating inside a competitive market. After the merger, the identical transaction pattern sits inside a combined entity controlling 41.5% of Seattle’s luxury listing side. Scale changes the regulatory and legal reading of identical conduct without changing the conduct itself. What reads as individual team practice at 3% market share reads as potential market foreclosure at 41.5%. The acquisition didn’t alter what Team Foster does — it altered what Team Foster’s conduct means structurally to every counterparty with enforcement authority.
The second tightening came from Compass’s own lobbying record. Placing a premium on exclusive listings as a profit strategy — marketing private exclusives to agents and investors as a dual-commission capture mechanism — while simultaneously deploying consumer privacy framing in state legislative testimony created a cross-forum evidentiary contradiction that any counterparty can now use as interpretive context. Compass’s federal litigation posture in Compass v. Zillow, asserting that restricted listing visibility harms consumers and forecloses competition, directly contradicts the consumer-choice framing advanced before Washington State legislative committees. CEO Reffkin’s Q1 2025 earnings call description of private exclusives as having “no downside” for sellers sits permanently in the record alongside Compass’s own client Disclosure Form acknowledging that the program may reduce buyer pool, offer volume, and final sale price. Both positions are in the public record. Neither disappears. The privacy rationale became less defensible not because address suppression changed, but because Compass’s own institutional record now contradicts it at every deployment.
The third tightening followed from documentation. Once the commission routing logic was named, mapped to specific transactions, and published with agent-level evidence, the information asymmetry that made the architecture sustainable began to narrow. The mechanism remains operational. But any new address suppression incident in the Seattle market enters an environment where NWMLS compliance officers, AG investigators, competing brokers, and legislative staff can access the revenue geometry and transaction-level pattern without constructing the analytical framework themselves. Interpretive cost for counterparties has dropped toward zero.
The replicability ceiling tightened at each stage. No single event foreclosed the strategy. The cumulative effect of acquisition-scale concentration, self-contradicting institutional messaging, and public documentation means the architecture operates in a materially different risk environment than the one that produced the original Team Foster model — and each additional Compass-controlled address suppression incident going forward is evaluated against that shifted baseline, not the baseline that existed when the practice began.
IV. The Detection Calculus: Price Thresholds and Institutional Response
A rational Compass-Anywhere decision-maker evaluating address suppression faces a single optimization problem with two competing objectives: maximize dual-commission revenue and minimize detection probability. The detection function does not operate linearly — a sharp inflection point separates the zone of plausible privacy accommodation from the zone of visible corporate strategy. Below the inflection point, suppression generates modest revenue inside institutional tolerance. Above it, the pattern becomes legible to counterparties and triggers enforcement.
Four price tiers structure the analysis, each with distinct privacy plausibility, transaction volume, revenue potential, and detection risk characteristics. Selecting the optimal tier requires balancing the revenue function (which increases with deployment volume) against the detection function (which also increases with deployment volume). Mapping the tradeoff at each level reveals whether any tier satisfies both constraints.
Tier-by-Tier Analysis
Revenue and detection characteristics across the four modeled tiers appear in the summary table below. Detailed analysis of each tier follows.

*Estimates derived from top-10 monthly dataset. Full market volume estimated at 10–15x sampled transactions.
Below $10 Million: Immediate Detection
Address suppression at the $5–10 million level appears anomalous in the Seattle market. Sellers at this tier expect full MLS exposure. Competing agents on the Eastside — the Windermere East agents who appear repeatedly in the dataset (Anna Riley, Denise Niles, Joan Bayley, Melissa Boucher) — know these neighborhoods intimately and can identify properties from square footage, lot descriptions, and submarket alone. Approximately 100 of 130 transactions in the dataset fall below $10 million. Deploying suppression across that range generates the highest revenue ($5–6 million annually from the sample) but produces 80+ detectable incidents per year — a volume that makes pattern recognition inevitable within one quarterly reporting cycle.
$10–15 Million: The Gray Zone
Some privacy justification exists at $10–15 million, but Eastside brokers’ market knowledge neutralizes the information asymmetry that suppression requires. A suppressed listing in Medina at $12 million narrows to three or four possible properties based on publicly available King County Assessor records — lot size, year built, assessed value, and legal description are freely searchable at blue.kingcounty.gov and cross-referenceable against NWMLS square footage and submarket descriptors within minutes. The Assessor’s public parcel search returns ownership, lot dimensions, and improvement value on every Medina residential parcel; a buyer’s agent with a client motivated at the $12 million price point needs only the MLS listing’s bedroom count, waterfront footage, and approximate acreage to reduce the candidate set to a handful of addresses. Independent buyer agents with motivated clients identify the property within days — typically 48–72 hours from listing entry, based on the operational cadence of agents who compete in this submarket month over month and monitor new MLS entries as a routine practice. The dataset documents this capacity directly: Windermere East agents (Anna Riley, Denise Niles, Joan Bayley, Melissa Boucher) won buyer-side commissions on Compass-controlled listings seven times through open-market competition across the 13-month sample, including on properties where Compass held listing-side advantages.
An agent network that successfully identifies and closes buyer representation on Compass-listed inventory under normal marketing conditions retains that identification capacity when address fields are suppressed. Suppression generates a 48–72 hour routing advantage — meaningful for the first internal call, insufficient for sustained exclusion. Revenue at this tier: $3–4 million annually from the sample. Detection incidents: 20–30 per year, concentrated in the same agent network that already competes for these listings month over month.
$15–20 Million: The Plausibility Frontier
Privacy framing becomes defensible at $15–20 million. Sellers at this tier include recognizable figures whose personal security concerns carry weight with both MLS compliance and the public. Transaction volume drops to 6–8 annually in the sampled data, producing $1–2 million in additional capturable buyer-side commission. Volume remains below institutional detection thresholds if suppression is not applied to every listing uniformly. Revenue contribution, however, is negligible against the combined entity’s debt service.
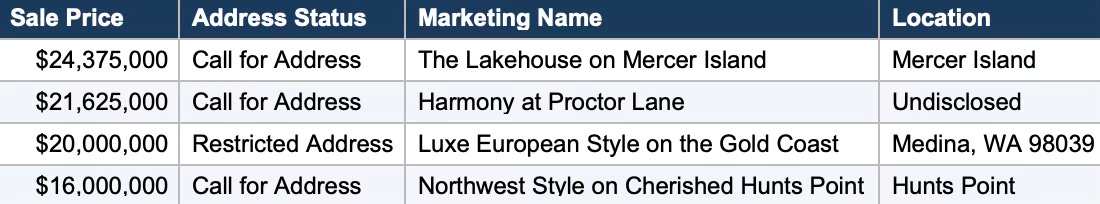
$20 Million and Above: Maximum Plausibility, Minimum Revenue
Ultra-luxury transactions above $20 million represent the tier where privacy framing is most credible and detection risk is lowest. Billionaire buyers and sellers routinely expect discretion, and competing brokers have limited ability to identify properties from partial MLS descriptions at this price level. However, the same characteristics that make the tier defensible — low transaction volume and high privacy tolerance — also make it revenue-irrelevant. Four transactions closed above $20 million in the thirteen-month sample:
One of four produced full dual-commission capture: the $20.25 million Foster/Skillman listing. Buyer-side captured: $506,250. One had zero Compass involvement. At this tier, address suppression remains undetectable and generates approximately $500,000 per year from the sampled data — a figure structurally irrelevant to a firm carrying $2.6 billion in assumed debt.
Across all four tiers, the same pattern holds: revenue scales with deployment volume, detection scales with deployment volume, and no intermediate tier satisfies both constraints simultaneously. The detection calculus produces a structural impossibility, not a difficult tradeoff. Sections V and VI apply game-theoretic frameworks to explain why the impossibility is durable rather than circumstantial.
V. The Corporate Containment Dilemma and Internal Ring-Fencing
When a legally precarious practice is exposed within a single, highly profitable business unit, the corporate parent faces a ruthless, binary containment problem: scale the practice or kill it. Compass-Anywhere cannot simply allow this architecture to exist in a vacuum. If the holding company attempts to ring-fence the address suppression mechanism—tacitly permitting high-volume nodes like Team Foster to deploy “Call for Address” on $79 million listings while denying the mechanism to rank-and-file agents—it manufactures a fatal internal vulnerability.
The approach creates a documented, two-tiered compliance structure. It artificially gates the highest-yield conversion tactic to a specific “dynasty” revenue node. In a brokerage model wholly dependent on agent retention, constructing a visible compliance firewall that protects one team while handicapping the broader roster risks an immediate internal defection cascade.
Yet, the alternative is equally catastrophic. As the simulation proves, scaling the architecture across the broader $5M+ portfolio to capture the full $7.04 million conversion frontier mathematically guarantees breaching the Stigler detection boundary. You cannot scale a covert operation without making it overt. The holding company is pinned perfectly between internal revolt and external regulatory velocity, with no viable pathway to simultaneously maximize revenue and evade detection.
VI. The Nash-Stigler Constraint
MindCast’s Dual Nash-Stigler Equilibrium Architecture (www.mindcast-ai.com/p/nash-stigler-equilibria) governs the strategic viability of address suppression at each price tier. Two equilibrium conditions jointly determine whether the strategy reaches a stable operating state or collapses under institutional response. Nash equilibrium identifies the multi-player stability point; Stigler equilibrium identifies the information sufficiency threshold. Both must hold for address suppression to persist at any given tier.
Nash Equilibrium: Multi-Player Stability
Address suppression operates in a five-player environment: Compass-Anywhere (deploying suppression), Windermere East and other independent brokerages (competing for buyer-side representation), NWMLS (enforcing listing rules), Washington’s Attorney General (monitoring UDAP compliance), and sellers (evaluating whether suppression serves their financial interests). Nash equilibrium identifies the price tier at which no player benefits from unilateral deviation — the stable operating state.
At $20M+, approximate Nash stability holds. Compass captures incremental revenue too small to attract institutional attention. Windermere agents have limited ability to identify suppressed properties before routing occurs. NWMLS treats ultra-luxury privacy as normalized industry practice. The AG’s office lacks sufficient volume for a pattern case. Sellers at this tier accept address suppression as standard. No player benefits from deviation.
Below $15 million, Nash stability breaks down across multiple players simultaneously. Windermere agents gain from publicly identifying the pattern — the dataset documents Windermere winning buyer-side commissions on Compass listings seven times through open-market competition, demonstrating both capacity and incentive. NWMLS compliance gains from enforcement that demonstrates the system’s integrity to its broker-owner membership. The AG’s office gains evidentiary volume sufficient for UDAP investigation — Washington’s AG Civil Rights Division has already confirmed enforcement authority on the record for this category of conduct. Sellers discover through competing offers (or the absence of them) that suppression may reduce their sale price. Each player’s incentive to deviate from tolerance increases as suppression volume rises.
Stigler Equilibrium: The Information Sufficiency Threshold
Stigler equilibrium determines when the evidentiary record reaches sufficiency — the point at which regulators, competitors, and counterparties possess enough documented information to act without further investigation. The detection threshold is the Stigler boundary.
Public documentation of the address suppression mechanism has lowered the interpretive cost for counterparties in the Seattle market. The Compass Commission Consolidation Strategy (www.mindcast-ai.com/p/compass-private-exclusives-monopoly) named the address suppression mechanism, documented the Triptych listing in real time, mapped the Foster-Skillman co-listing-to-co-buyer conversion pattern across 130 transactions, and quantified buyer-side commission flows by category. The Compass Narrative Inversion Playbook (www.mindcast-ai.com/p/compass-narrative-inversion-playbook) — prepared as a direct briefing for state legislators and attorneys general — documented Compass’s three-tier opposition apparatus, the 17:1 Astroturf Coefficient (162 Compass-affiliated opposition witnesses, only 9 disclosing affiliation), and the cross-forum contradiction between Compass’s federal litigation posture and its state legislative testimony. The counterparties who would detect an address suppression pattern — legislative staff, AG investigators, competing brokerages — have already been handed the analytical tools to interpret the mechanism.
Before public documentation of the mechanism, address suppression operated below the interpretive threshold — counterparties lacked the analytical framework to distinguish privacy accommodation from commission routing. Public availability of named transactions, mapped agent roles, and quantified commission flows reduces the interpretive cost for any counterparty evaluating whether a pattern exists. Each additional Compass-Anywhere listing that suppresses an address enters a market where that interpretive framework is accessible. The strategy’s information advantage — the asymmetry between what Compass knows about the mechanism’s purpose and what counterparties know — has narrowed.
Stigler equilibrium has shifted. Address suppression in the Seattle market now operates below the detection threshold only at the $20M+ tier — precisely the tier where revenue is negligible. At every tier where revenue becomes meaningful, the evidentiary record already exceeds the sufficiency threshold required for institutional response.
Nash stability breaks down below $15 million because multiple counterparties gain from deviation simultaneously. Stigler sufficiency has already shifted because the interpretive framework for recognizing address suppression as a capture mechanism now exists in the public record. Section VI examines the behavioral dynamics of how a rational platform operates within these dual constraints over time.
VII. Runtime Strategic Dynamics: Chicago Law & Behavioral Economics and Chicago Strategic Game Theory Analysis
Sections IV and V establish that revenue adequacy and detection avoidance are inversely correlated across every price tier. A static optimization model would stop there. But rational platform operators do not make binary deploy/don’t-deploy decisions — they probe, delay, retreat, and repeat. Understanding the temporal dynamics of how a merged entity operates within the structural constraint requires a behavioral framework that models real-time strategic interaction.
MindCast’s Chicago Law & Behavioral Economics (LBE) framework synthesizes classical price theory (Coase → Becker → Posner) into a structured institutional analysis. The companion Chicago Strategic Game Theory (CSGT) framework models real-time strategic interaction under mutable rules. Both are documented in Chicago School Accelerated(www.mindcast-ai.com/p/chicago-school-accelerated). Applied to the address suppression scenario, Chicago LBE explains why scale collapses; CSGT explains how the platform optimizes within that constraint.
Coase Vision — Coordination Capacity Governs Viability
Address suppression converts a shared listing infrastructure — NWMLS — into a routing gate. Coase’s foundational insight applies directly: transaction costs determine whether collective action against the mechanism succeeds or fails. If counterparties can coordinate cheaply and quickly, suppression collapses. If coordination is expensive or slow, suppression persists. Measuring coordination capacity in the Seattle luxury market determines how long suppression can operate before counterparties neutralize it.
Seattle’s Eastside luxury market presents high coordination capacity. Agents compete monthly for the same listings in the same submarkets — Anna Riley and Denise Niles of Windermere East, Melissa Boucher, Joan Bayley appear repeatedly across the 130-transaction dataset. Broker-to-broker information flows are dense, referral networks are tight, and listing-side market knowledge runs deep enough that address suppression loses its information asymmetry edge: experienced Eastside agents can identify a suppressed Medina or Clyde Hill listing from square footage, lot description, and submarket position alone. Pattern recognition in this environment occurs within one to two quarters, not years.
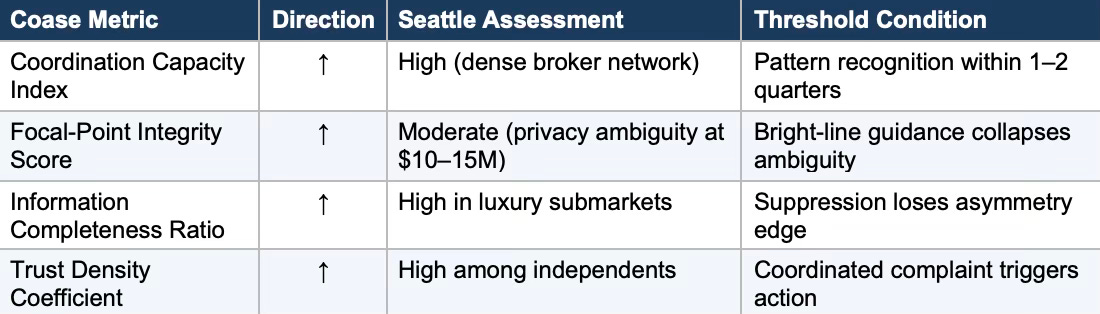
Direction: ↑ = higher values strengthen counterparty response capacity.
Coase Output: Captured Infrastructure Risk below $15M. Tolerated Exception above $20M. The coordination environment determines which regime applies at each tier.
Becker Vision — Incentive Exploitation Under Low Enforcement Probability
Post-merger internalization shifts commission flows that previously crossed firm boundaries into internal capture. Becker’s framework identifies the exploitation window: the gap between the economic incentive to deploy suppression and the expected enforcement cost. When enforcement appears uncertain or delayed, rational actors probe the boundary — deploying the mechanism incrementally and observing whether sanctions follow. Exploitation emerges precisely in the $10–15 million gray zone where privacy framing retains partial plausibility and NWMLS enforcement history provides no bright-line precedent.
Four behavioral metrics capture the exploitation dynamics. Behavioral Drift Factor measures whether suppression incidents normalize over time. Incentive Alignment Index tracks whether internal reward structures encourage expansion. Switching-Cost Gradient captures seller inertia — the tendency of prestige-segment sellers to accept routing framing rather than challenge their listing agent. Expected-Value Sorting Index measures competitor resistance — whether independent brokerages escalate complaints or absorb losses silently.
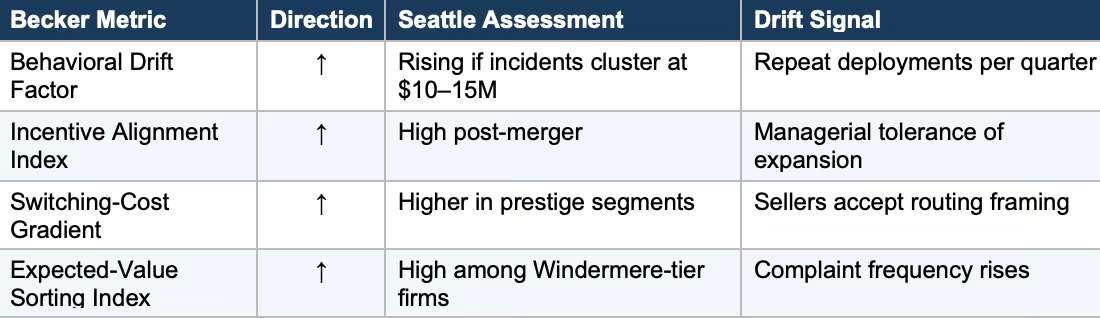
Direction: ↑ = higher values indicate stronger drift toward exploitation or resistance.
Becker Output: Probe-and-escalate in gray zone; retreat to ultra-luxury if resistance spikes. The Team Foster architecture already exhibits this pattern: address suppression deployed on ultra-luxury listings where privacy framing is defensible, with no documented expansion into the $10–15M tier where enforcement ambiguity would be tested.
Posner Vision — Correction Feasibility Within the Harm Window
Institutional learning speed determines whether suppression locks in as a normalized practice or collapses under regulatory correction. Posner’s framework distinguishes kind environments (fast feedback, clear correction signals) from wicked environments (delayed feedback, fragmented correction authority). The outcome hinges on whether NWMLS, the AG’s office, and the legislature converge on enforcement or fragment across venues.
Seattle’s regulatory landscape presents a mixed signal. NWMLS has already prohibited private exclusives — a clear enforcement signal. But address suppression operates in a gap between the private exclusive prohibition and the absence of a specific address-disclosure requirement. Enforcement Lag Index measures how long that gap persists. Institutional Update Velocity measures how quickly NWMLS converts the documented pattern into formal compliance guidance. Doctrinal Fragmentation Score captures whether enforcement authority splits across institutions in ways that delay coordinated response.
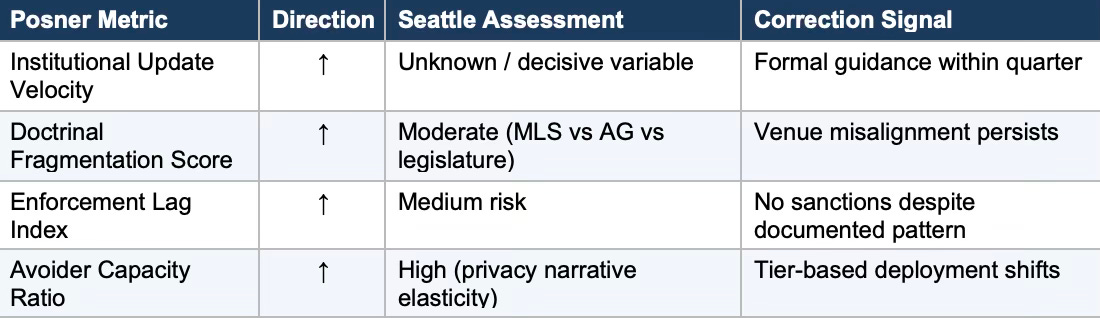
Direction: ↑ = higher values indicate faster correction (IUV) or wider harm window (DFS, ELI, ACR).
Posner Output: Kind Environment if NWMLS issues bright-line guidance rapidly. Wicked Environment if venues fragment and enforcement lag extends. The decisive variable is Institutional Update Velocity — how quickly NWMLS converts the documented pattern into a formal compliance standard.
CSGT Vision — The Delay-Dominant Equilibrium
Chicago Strategic Game Theory models real-time interaction under mutable rules. Address suppression does not operate inside a fixed regulatory game. Privacy framing is elastic, enforcement thresholds are ambiguous, and the boundary between tolerated accommodation and prohibited routing shifts with each institutional response. Aggressive rollout is not the dominant equilibrium in this environment. Delay is.
Four CSGT metrics capture the delay dynamics. Strategic Delay Preference Index measures the gap between immediate revenue capture and deferred enforcement cost — a high index means revenue arrives now while enforcement arrives later. Rule Mutability Score captures how easily the privacy-versus-routing framing can be adjusted in response to scrutiny. Inquiry Suppression Ratio measures whether address omission raises the audit costs that investigators face when tracing commission flows. Equilibrium Persistence Under Loss measures whether even marginal gains justify continued probing.
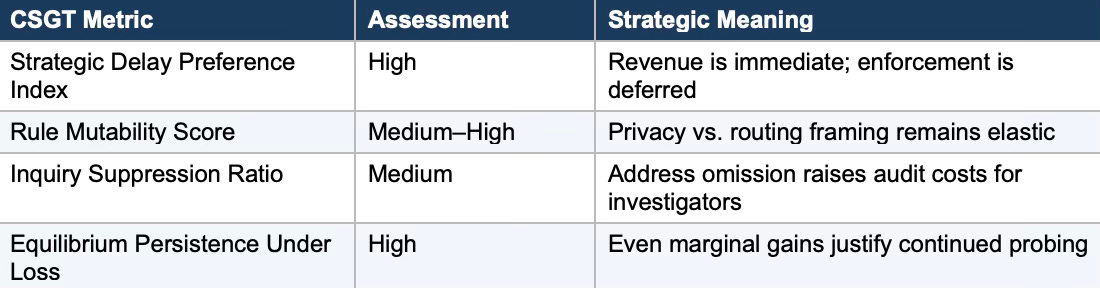
CSGT analysis identifies a four-phase delay-dominant strategy:
• Phase 1: Micro-scale deployment in defensible tiers ($20M+) where privacy framing is normalized.
• Phase 2: Preserve narrative ambiguity — maintain “seller privacy” positioning while capturing routing revenue.
• Phase 3: Fragment enforcement forums — exploit the gap between NWMLS rules, AG jurisdiction, and legislative process to avoid concentrated scrutiny from any single institution.
• Phase 4: Retreat upon concentrated scrutiny — if enforcement converges, withdraw to ultra-luxury tier and wait for institutional attention to disperse.
Team Foster’s architecture already exhibits this equilibrium. Address suppression operates on a handful of ultra-luxury listings. Privacy framing remains intact. No enforcement response has materialized. MLS #2392995 — the Triptych listing at $79 million — is Phase 1 executed in plain sight. Whether the architecture scales depends on whether the platform can sustain Phase 2 ambiguity while expanding into lower tiers. Coase and Becker analyses demonstrate that Seattle’s coordination capacity and competitor resistance make sustained Phase 2 ambiguity untenable below $15 million.
Falsification Timeline
Chicago LBE + CSGT analysis produces falsifiable predictions on a quarterly horizon. Each checkpoint identifies observable market signals that confirm or refute the simulation’s equilibrium classification:
Quarter 1: Observe suppression incident count by price tier across Compass-Anywhere listings in the Seattle market. Baseline: current deployment appears concentrated at $20M+ (Team Foster model). Expansion into the $10–15M tier constitutes a measurable signal.
Quarter 2: Assess NWMLS response — whether formal guidance, compliance inquiries, or enforcement actions emerge in response to documented suppression patterns. Measure complaint volume from independent brokerages.
Quarter 3: If suppression volume declines or remains confined to $20M+, coordination dominated the equilibrium — counterparty response velocity exceeded probing velocity. If suppression volume increases into the $10–15M tier without institutional sanction, the delay-dominant equilibrium is confirmed and the exploitation window remains open.
Quarter 4: Cross-venue alignment determines long-term equilibrium class. If NWMLS enforcement, AG monitoring, and legislative record converge on the address suppression mechanism, the harm window closes. If venues remain fragmented, the Posner environment is wicked and the delay equilibrium persists into subsequent cycles.
Equilibrium resolves when enforcement velocity exceeds probing velocity. Until then, the strategy oscillates inside a narrow band between marginal revenue and rising detection probability. No position within that band generates revenue sufficient to service acquisition debt regardless of where the platform operates.
VIII. Revenue Ceiling vs. Debt Service
Sections IV through VI establish that address suppression operates under dual structural constraints: revenue scales with deployment volume, and detection scales with deployment volume. Quantifying the revenue ceiling at each deployment level against the merged entity’s actual debt obligations converts the theoretical constraint into a concrete arithmetic problem. Compass-Anywhere’s financial structure determines whether any suppression strategy generates revenue material enough to justify the institutional risk it creates.
Four deployment scenarios model the tradeoff from full-portfolio suppression down to ultra-luxury-only deployment. Revenue figures derive from the 130-transaction dataset; national estimates represent illustrative bounds, not projections.
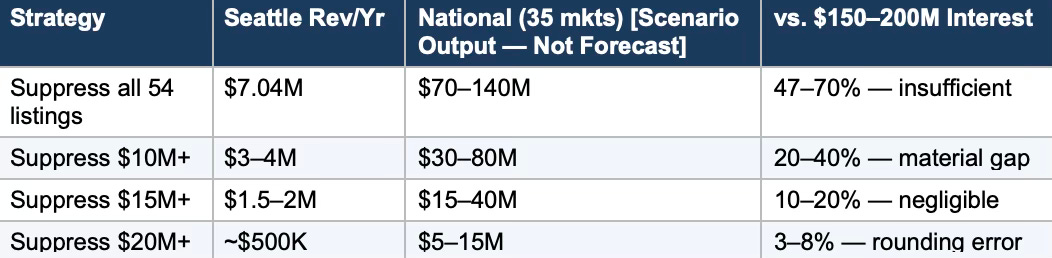
Compass-Anywhere assumed approximately $2.6 billion in debt from the Anywhere Real Estate acquisition. Annual interest service at prevailing rates runs $150–200 million. Even at maximum deployment across every Compass-controlled listing in the Seattle dataset, address suppression generates $7.04 million annually from the sampled data. National figures in the table above are scenario outputs, not projections or forecasts: ultra-luxury transaction density, commission rate compression at the highest tiers, and listing-side market share vary dramatically across metros, and no independent data source verifies that Seattle’s internalization rate or transaction concentration replicates in other Compass markets. Scaling the Seattle sample to 35 markets under generous and unverified assumptions about comparable density produces $70–140 million — a range intended to establish order of magnitude only. Readers should treat figures in the “National” column as illustrative upper bounds under best-case assumptions, not as estimates of likely outcomes. Even at the upper bound, the figure represents roughly half to two-thirds of annual interest obligations.
Maximum national revenue requires full-portfolio deployment: suppressing addresses on every Compass-controlled listing across every major market simultaneously. Full-portfolio deployment at the sampled rate would produce hundreds of detectable suppression incidents nationally per year, generating the cross-market evidentiary record that transforms enforcement from a single-jurisdiction inquiry into coordinated multi-state action. Precise detection thresholds — the volume at which NWMLS enforcement, AG investigation, or competitor complaints trigger — are not publicly documented and cannot be calibrated from available data. Detection operates as a qualitative step function: the threshold exists, and the directional relationship between deployment volume and detection probability is unambiguous, even if the exact inflection point remains unknown.
For capital structure purposes, the arithmetic is dispositive. Platform-level address suppression cannot close the gap between Compass-Anywhere’s operating revenue and its debt service obligation. Even under the most aggressive deployment scenario — full-portfolio suppression across 35 metro markets — the strategy generates at most 47–70% of annual interest cost while producing the enforcement volume that makes the revenue stream unsustainable. Investors evaluating Compass-Anywhere’s post-merger balance sheet should model debt service capacity from operational revenue, agent retention, and market share competition — not from capture strategies that carry regulatory termination risk.
The strategy that generates sufficient revenue to matter is the strategy that generates sufficient evidence to end it. No intermediate position exists. Revenue adequacy and detection avoidance are structurally incompatible objectives across every price threshold modeled in this simulation.
IX. Simulation Finding
Eight sections of analysis converge on a single finding. A rational Compass-Anywhere decision-maker evaluating address suppression as a dual-commission capture strategy faces an insoluble optimization problem: the revenue function and the detection function are inversely correlated at every price tier, with no equilibrium point where both constraints are simultaneously satisfied. Chicago LBE confirms that counterparty coordination capacity in Seattle’s luxury market is sufficient to neutralize suppression below $15 million within one to two quarters. CSGT confirms that the dominant rational response is delay-based probing within ambiguity bands, not aggressive rollout.
At the $20M+ tier, address suppression reaches approximate Nash stability — counterparties tolerate the practice as a normalized privacy accommodation, and detection risk is minimal. Revenue from the sampled data: approximately $500,000 per year in one market. Scaled nationally: $5–15 million. Against $150–200 million in annual interest obligations, the strategy contributes a rounding error. A rational firm would not build corporate infrastructure around a mechanism that generates 3–8% of interest coverage.
At the $10–15M tier, revenue reaches $3–4 million per market from the sampled data — scaling to $30–80 million nationally. At this level, the revenue begins to matter. But 20–30 suppression incidents per year in a single metro produce the detection volume that shifts the Stigler boundary below the deployment level. Windermere East agents, who won buyer-side commissions on Compass listings seven times through open-market competition in the dataset, possess both the market knowledge to identify suppressed properties and the competitive incentive to report them. NWMLS compliance, already enforcing private exclusive prohibitions against Compass nationally, gains a documented pattern. The AG’s office gains the incident volume that converts a monitoring posture into an investigation.
At full-portfolio deployment ($5M+), the mechanism generates maximum revenue — $7.04 million per market from the sampled data, $70–140 million nationally — but operates above every detection threshold simultaneously. Nash stability collapses across all five players. Public documentation of the suppression mechanism has already lowered the interpretive cost for counterparties in the Seattle market. Each additional market where the pattern appears accelerates the evidentiary cascade.
No address suppression threshold converts the Compass-Anywhere merger into a dual-commission capture engine that services the acquired debt. Suppression works at the team level — one team, one submarket, a handful of transactions per year. Scaling that architecture across a 41.5% listing-side market share transforms an individual team practice into a detectable corporate strategy. Moving from team-level accommodation to platform-level deployment is the transition from Nash stability to Nash instability.
Post-merger Compass-Anywhere will compete in the Seattle market on service quality, agent talent, brand strength, and operational efficiency — or it will attempt a capture strategy that collapses under its own evidentiary weight. No alternative equilibrium emerges from the modeled dataset.
X. Conclusion- The Cross-Forum Antitrust Inversion
The defense of this architecture requires a dizzying legal and narrative inversion, one that exposes Compass to significant liability across concurrent legal forums. Compass’s current federal antitrust litigation posture—specifically its Sherman Act claims against Zillow in the Southern District of New York—asserts that restricting listing visibility fundamentally harms consumer choice and forecloses competition. Compass argues that Zillow’s refusal to aggregate off-market listings is an illegal boycott.
Simultaneously, the deployment of the Team Foster model requires arguing the exact opposite before Washington State legislative committees. To protect the address suppression architecture, Compass must testify that restricting visibility is not an anticompetitive harm, but a vital consumer privacy right.
This structural contradiction is permanently recorded. Furthermore, applying Verizon v. Trinko to their own logic creates an antitrust paradox: Compass demands open access to Zillow’s platform under the guise of competition, while engineering a closed-loop system locally to exclude independent brokerages from its own listings. By utilizing the mechanism post-closing on public tax records, the privacy rationale is empirically exhausted. This transforms the firm’s primary marketing narrative into an actionable evidentiary liability, providing state regulators and the House Consumer Protection Committee with the exact legal dissonance needed to dismantle the practice.
Appendix: Methodology, Limitations, and Scope
Every simulation depends on assumptions, and those assumptions constrain the validity of its outputs. Documenting the boundaries of the analysis — what data the simulation uses, what it excludes, what it claims, and what it does not claim — allows readers to assess the findings on their merits and identify precisely where legitimate disagreement may arise. Three categories of methodological constraint apply.
Dataset Limitations
Seattle Agent Magazine publishes the ten most expensive residential sales in greater Seattle each month, sourced from NWMLS records. Thirteen months of data — January 2025 through January 2026 — comprise the 130-transaction sample. Because the sample represents the upper tail of the market distribution rather than the full residential transaction universe, findings describe patterns within the sampled range and should not be extrapolated to the broader market without independent verification at other price tiers and in other geographic markets.
National revenue estimates are scenario outputs — not projections or forecasts — derived by applying the sampled internalization rate to assumed transaction volumes across 35 Compass metro markets. The assumption that Seattle’s top-10 concentration, dual-commission capture rate, and listing-side market share replicate across other metros is unverified and may not hold. Ultra-luxury transaction density, commission rate structures, listing-side market share, and regulatory environments vary substantially across metros. The national figures establish order of magnitude only and should be treated as illustrative upper bounds under best-case assumptions rather than as estimates of likely outcomes. Readers evaluating Compass-Anywhere’s strategic options should weight the Seattle figures — derived from 130 independently verifiable transactions — and treat the national column as directional framing subject to substantial downward revision under real-market conditions.
No Allegations of Rule Violation
No allegation of rule violation is made against any individual, team, or brokerage. Address suppression is described as a mechanism currently deployed in the Seattle market on documented active listings. Revenue and detection consequences of scaling that mechanism across a hypothetical merged portfolio constitute a forward-looking strategic analysis, not a backward-looking compliance assessment.
References to specific agents, teams, and transactions are drawn from publicly available NWMLS records and Seattle Agent Magazine reports. Role designations (listing broker, co-listing broker, buyer broker, co-buyer broker) are reproduced as recorded by NWMLS. Structural descriptions of team-level routing architecture are inferences from the public transaction record — patterns observed in the data — not assertions about the intent, motivation, or state of mind of any individual.
Simulation Assumption Boundaries
Time-shift methodology reclassifies pre-merger transactions as Compass-controlled based on post-merger corporate ownership. Reclassification does not assume any change in agent behavior, client relationships, or brokerage operations. Commission internalization under the merged entity is a P&L accounting outcome, not a behavioral claim.
Detection thresholds are modeled qualitatively. NWMLS enforcement data, complaint volumes, and compliance action triggers are not publicly available at sufficient granularity to calibrate precise inflection points. The simulation establishes directional relationships between deployment volume and detection probability; the exact threshold at which institutional response triggers remains an empirical question that the simulation identifies but does not resolve.
Buyer-side commission is calculated at 2.5% of sale price throughout the analysis. Actual commission rates at the $5M+ level range from 2.5% to 3%; rates at $20M+ frequently compress to 2% or below, sometimes to flat-fee arrangements. Revenue estimates at the highest price tier may overstate actual commission capture. All revenue figures for the conversion opportunity (buyer-side commission currently going to independent agents) represent ceilings, not floors.
Sources and Citations
Data Sources
Seattle Agent Magazine. Monthly top-10 most expensive residential sales reports, January 2025 through January 2026. www.seattleagentmagazine.com. 130 transactions, independently verifiable through NWMLS public records.
Northwest MLS (NWMLS). Transaction records, agent role designations, and listing data. Independently verifiable at public search portals.
Team Foster / Compass. Active listing inventory and sold history documented at fosterrealty.com, accessed and archived by screenshot February 19, 2026.
Corporate Sources
Anywhere Real Estate Inc. Q3 2024 Earnings Release, October 2024 (prnewswire.com). FY 2024 Earnings Release (anywhere.re). Net corporate debt: $2.4–$2.5 billion.
Compass, Inc. 8-K/A Post-Merger Filing (stocktitan.net). Deal structure: $1.6 billion all-stock transaction plus assumption of approximately $2.6 billion in Anywhere debt.
Compass, Inc. v. Zillow, Inc., No. 1:25-CV-05201, S.D.N.Y. Preliminary injunction denied February 6, 2026 (Judge Jeannette A. Vargas).
Methodology Notes
Buyer-side commission calculated at 2.5% of sale price (conservative; the $5M+ luxury segment ranges 2.5–3%). Commission rates at $20M+ often compress to 2% or below, which would further reduce revenue estimates at the highest tier. National scaling assumes 10–15x the sampled top-10 volume across 20–30 comparable Compass metro markets. All figures represent floors, not ceilings, for the category where Compass already captured both sides, and ceilings, not floors, for the conversion opportunity.