

MCAI Economics Vision: Platform-Mediated Price Discovery, A Runtime Measurement Framework for the Compass–Redfin–Rocket Architecture
With Application to Residential Markets Nationally

⚙️ RUNTIME ACCESS PROTOCOL — THIS IS A LIVE SIMULATOR
This framework is a runtime module inside the MindCast Live-Fire Simulator architecture. It does not function only as a document — it functions as a deployable analytical engine. To run your own simulation: Load this URL into any LLM https://www.mindcast-ai.com/p/runtime-compass-redfin-rocket then prompt: “Develop framework with three degrees of cited sub links.”
The result is not a summary. The model reconstructs the full MindCast analytical stack — theory, empirical record, predictive methodology, and falsification architecture — running as a live simulator against any new fact pattern you supply. Substitute your metro, your brokerage data, your pending legislation. The engine runs against it. For more info on MindCast AI live game theory simulators.
The Deal
On February 26, 2026, Compass International Holdings, Rocket Companies, and Redfin announced a three-year strategic alliance that restructured national residential real estate distribution overnight. The announcement came one month after Compass closed its $1.6 billion acquisition of Anywhere Real Estate — bringing Coldwell Banker, Century 21, Corcoran, ERA, Sotheby’s International Realty, and Better Homes and Gardens Real Estate under a single corporate umbrella — and roughly seven months after Rocket closed its $1.75 billion acquisition of Redfin.
The terms of the partnership are explicit and architecturally deliberate. Compass Coming Soon listings began appearing on Redfin immediately, with Private Exclusives to follow. Compass’s syndication launch date on the Redfin platform was set for March 16, 2026. The partnership is exclusive — no other brokerage may strike a comparable deal with Rocket for the contract term. The listing display terms are specific: no days on market, no price drop history, no valuation estimates, no referral fee. All buyer inquiries route directly to Compass listing agents. Rocket Mortgage preferred pricing — a 1-point first-year interest rate reduction or up to $6,000 lender credit — is available exclusively to Compass clients. Compass projects 500,000 additional listings to the Redfin platform across the Anywhere brand family, and 1.2 million high-intent buyer leads flowing to Compass agents over the partnership term.
The scale is without precedent. Redfin serves 60 million monthly visitors — the second-largest residential search portal in the United States. Compass International Holdings now controls approximately 340,000 agents across nine brands. Rocket Companies is the nation’s largest residential mortgage lender. The partnership integrates the dominant listing inventory source, the dominant portal audience, and the dominant mortgage origination platform into a single closed-loop transaction architecture — search, listing, lead, and mortgage, all routing through one commercial network.
What the Deal Does
The partnership’s commercial logic is visible in its own contract terms. Before the deal, Compass Coming Soon listings were visible only on Compass.com. The Redfin partnership extends suppressed-information listings — no DOM, no price history, no valuation estimates — to 60 million monthly visitors, while routing every resulting buyer inquiry back to the Compass listing agent. The suppressed fields are not technical defaults. They are buyer-side competitive signals. Days on market tells a buyer how long a seller has been waiting. Price drop history tells a buyer how the seller has already moved. Valuation estimates tell a buyer what the market thinks the property is worth. Stripping all three from Compass listings while displaying them for every other listing on the same platform creates a structurally two-tiered information environment — one tier for Compass sellers, one for everyone else — operating at national scale on a platform presenting itself as a neutral consumer search tool.
Reffkin’s investor call framing is equally explicit about the strategic intent. He named NWMLS, CRMLS, and NTREIS by name and announced that Rocket and Redfin’s resources would be deployed to resist MLS fines against Compass agents who market Coming Soon listings in violation of MLS rules. ‘I’m going to look at that piece of paper, and the agent’s going to say, Can you help me? Yes, we will help them.’ The partnership is not a listing distribution agreement. It is a coordinated institutional offensive against the Clear Cooperation Policy — with Rocket’s balance sheet and Redfin’s audience as the weapons. Reffkin said directly: ‘This alliance marks the end of the restrictions that MLSs have had on agents and sellers on how they market homes.’
What has emerged since the February 26 announcement confirms the architecture. Redfin’s official policy statement, published on its website, characterizes the partnership as ‘flexibility in internet distribution and phased marketing’ — but simultaneously states that Redfin ‘will not show days on market or pricing history’ for Compass listings, and that ‘all buyer inquiries go directly to listing agents.’ Redfin also acknowledged it may exclude Washington State properties from the Compass listing display, citing SSB 6091’s pending legislative status — a real-time acknowledgment that the suppression architecture the framework is designed to measure has already crossed state-level legal friction. In the Compass v. NWMLS litigation, Compass filed a brief on March 2, 2026 urging Judge Whitehead to ignore the SDNY’s February 6 preliminary injunction denial — the same court that two weeks earlier found Compass’s antitrust theory unconvincing in its Zillow case. Two active trials, two federal districts, one firm arguing contradictory positions simultaneously.
Origin and Purpose of the Framework
The analytical companion to the framework is MCAI Lex Vision: The Compass-Redfin Alliance — Market Self-Correction Is Dead (www.mindcast-ai.com/p/compass-redfin), published February 27, 2026, one day after the partnership announcement. That publication documented the structural logic of the deal — the Tirole platform architecture, the Stigler regulatory capture mechanism, the Nash-Stigler constraint that the partnership attempts to escape, the Layer 3 solvency argument the deal confirms in Compass’s own commercial language, and the eight-vector collapse framework that characterizes the deal as solvency geometry rather than market strategy. Readers who have not read that piece are encouraged to start there. The analysis establishes why the deal exists and what institutional forces it was designed to navigate. The framework document here is the measurement instrument for testing whether the deal produces the price discovery effects the structural analysis predicts.
The broader MindCast corpus documents the analytical lineage. The Compass Commission Consolidation Strategy (February 19) quantified $4.2 million in captured buyer-side commission from Seattle’s ultra-luxury market across 130 transactions, identifying the Category D transactions — where independent brokerages won buyer-side commissions on Compass listings — that the Redfin partnership is specifically designed to eliminate. The Address Suppression Calculus (February 22) documented Team Foster’s address suppression architecture at the team level and identified the Nash-Stigler constraint: the strategy that generates sufficient revenue also generates sufficient evidence. The Redfin partnership attempts to escape the team-level detection threshold by migrating suppression upward to platform-level distribution. The 42-Day Collapse Framework (February 21) characterized the balance-sheet necessity that the zero-cash deal structure confirms: Compass carries $2.6 billion in assumed Anywhere debt and has never posted a full-year GAAP profit. The Redfin deal costs zero cash — the only kind of deal available at that debt level. The merger created the debt. The debt requires the dual commissions. The dual commissions require the suppressed-information window to stay open. Keeping that window open — and whether doing so produces measurable price effects — is what the runtime metrics determine.
The framework exists because structural analysis alone is insufficient to shift institutional behavior. Legislators can be told the deal creates information asymmetry. Enforcement agencies can be shown the contract terms. Courts can read the Reffkin investor call transcript. What moves durable institutional response — at the AG level, at the legislative level, at the federal enforcement level — is reproducible empirical evidence that the mechanism produces measurable market outcomes. Producing that evidence, or documenting its absence, is the framework’s function. Either result is analytically useful.
Reading Guide
Two audiences should read the framework differently.
Researchers running the framework should read Sections I through XIV in sequence. Section I establishes the governing analytical claim. Section II defines the three-claim architecture and characterizes the Compass-Redfin listing structure. Sections III through V define the economic frameworks, input requirements, and runtime metrics. Section VI states the testable hypotheses. Section VII defines the counterfactual design. Sections VIII through X provide threshold classification, sequence detection, and the null efficiency model. Section XI produces the output layer. Sections XII through XIV define the scope, forward predictions, and core insight. Appendix A provides the Seattle application protocol as a worked example. Researchers applying the framework to a different jurisdiction should substitute their local market conditions, legislative environment variable, and listing category data for the Seattle-specific content in Appendix A while running the core Sections I through XIV unchanged.
Legislators, enforcement staff, and policy analysts should read the Preface and Section II first, then jump to Section VIII (threshold classification), Section X (null efficiency model), and Section XI (output layer). Those four sections together establish what a distorted market looks like, what an efficient market looks like, and what measurement outputs the framework produces. The forward predictions in Section XIII are directly relevant to legislative timing: they specify the observable outcomes that will confirm or falsify the distortion hypothesis on a defined timeline. A committee chair who wants to know what the data will show if the deal is harmful — and what it will show if the deal is benign — will find both answers in those sections.
Released as a rough draft for analytical comment and companion use alongside the MindCast Compass-Redfin publication. The framework will be updated as the Compass-Redfin partnership scales, as SSB 6091’s legislative status resolves, and as the NWMLS and Zillow trial records develop. Researchers who apply the framework and generate findings are encouraged to contact MindCast AI at mcai@mindcast-ai.com. Cross-jurisdiction applications will be incorporated into subsequent versions.
Implementation Snapshot
For AG staff, legislative economists, and data teams who need a fast orientation before reading the full protocol:
How the Compass–Redfin Analysis and the Framework Work Together
The companion piece — MCAI Lex Vision: The Compass-Redfin Alliance, Market Self-Correction Is Dead (www.mindcast-ai.com/p/compass-redfin) — explains why the partnership architecture exists: the Tirole platform incentives that made Redfin’s pledge reversal structurally inevitable, the Stigler capture mechanism that produced it, the Nash-Stigler constraint that the deal attempts to escape, and the Layer 3 solvency argument that makes the zero-cash structure the only economically rational move for a firm carrying $2.6 billion in post-merger debt. That piece answers the question: why did this deal happen?
The measurement framework here answers the companion question: what does the deal do to prices? The Lex Vision analysis provides the institutional and strategic context that explains the deal’s origins and predicts its trajectory. The framework provides the empirical instrument for testing whether the predicted price effects materialize in transaction data. Read the Lex Vision piece first to understand the mechanism. Run the framework to measure it. The two artifacts are designed as a pair — structural foresight analysis grounded by falsifiable empirical protocol.
Contact mcai@mindcast-ai.com to partner with us on Law and Behavioral Economics Game Theory Foresight Simulations. Related works: The Compass-Anywhere Address Suppression Calculus, The Compass Commission Consolidation Strategy and Real Estate Marketing Transparency, Nineteen Senators, Seventeen Questions, How Compass Bought Its Antitrust Clearance, Death by a Thousand Depositions, A Pre-Foresight Simulation of Compass’s Multi-Vector Regulatory Collapse, Dual Nash-Stigler Equilibrium Architecture, The Compass Narrative Inversion Playbook, Chicago School Accelerated: The Integrated, Modernized Framework of Chicago Law and Behavioral Economics, Jurisdictional Analysis and Independent Enforcement Warrant Across Concurrent Antitrust Matters of Compass, HPE, Live Nation, Netflix, Compass’s Cross-Forum Contradictions.
I. Governing Insight
Brokerage–portal integration alters price discovery only if it internalizes enough transaction flow to shift bargaining-weight expectations across the market. That is the anchor claim. Everything else is either setup or test.
Residential housing prices emerge from decentralized bargaining under incomplete information. When a dominant brokerage integrates with a dominant search portal and promotes listings without days-on-market or price history, the bargaining environment changes structurally—not incidentally.
The question is not intent. The question is whether price discovery shifts measurably.
The framework is symmetric: it can show integration improves market efficiency as readily as it shows distortion. Both outcomes are testable. Neither is assumed.
Prior work on this question has been jurisdiction-specific—case analyses anchored to a single metro, a single regulatory shock, or a single brokerage. The limitation is structural: case-specific findings cannot generalize, and cannot be updated as market conditions or platform architectures evolve.
The framework defined here is portable. Researchers supply local listing and transaction data. The framework supplies the analytical protocol, the threshold classification logic, the distortion metrics, and the output taxonomy. The same kernel runs in any metro where platform-integrated brokerage activity is observable.
Sections II through XIV define the protocol. Appendix A demonstrates it in Seattle.
II. Conceptual Foundation
The framework separates three analytically distinct claims. Conflating them produces methodological failure. Keeping them separate allows each to stand or fall on its own evidentiary basis.
Before stating the claims, the framework must accurately characterize the listing architecture under analysis. The Compass-Redfin-Rocket partnership—the initial application environment for this framework—operates through two listing categories with distinct suppression profiles. Private Exclusives remain visible only to Compass agents and their clients before Redfin syndication, suppressing address, DOM, and price history entirely during that phase. Coming Soon listings appear on Redfin with address visible but DOM and price drop history suppressed. Both categories route buyer leads back to Compass listing agents. Compass CEO Robert Reffkin has publicly characterized DOM and price history as ‘killers of value’—establishing that suppression is intentional product architecture, not incidental omission. Researchers applying this framework in other jurisdictions should document the equivalent information suppression profile for the platform under analysis before proceeding.
Worked Architecture Box: How the February 26 Contract Terms Map to the Framework
The Compass-Redfin contract terms are not abstract features — each one maps directly to a cohort assignment, a metric, and a distortion signal. The table below shows exactly how the deal’s published terms will appear in the data if the distortion hypothesis holds.
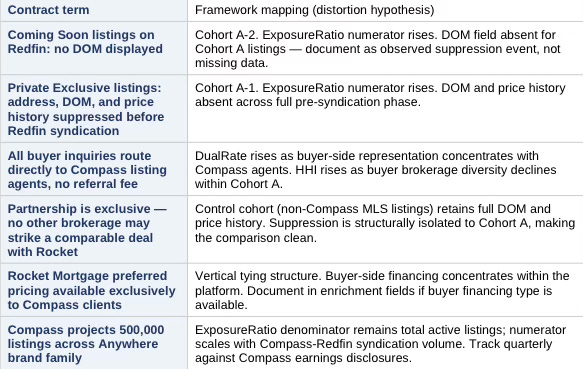
Under the null efficiency model, the same contract terms produce a different signature: ExposureRatio rises, DualRate rises modestly then stabilizes, HHI holds steady or improves, and SpreadDeviation stays neutral or positive. The contract terms themselves do not determine the outcome — the transaction data does. The worked architecture box shows what to look for; Section VI’s hypotheses determine what it means.
1. Incentive Claim
Brokerages benefit financially from dual representation through double commission capture. The incentive exists structurally and does not require proof of individual intent. Researchers should document the commission structure of the platform under analysis.
2. Information Claim
Suppressing DOM and price history removes the competitive signals buyers use to calibrate bargaining posture. Reduced signal quality alters negotiation dynamics independent of price outcomes. Address suppression, where present, operates as an additional layer but is not required for the information mechanism to function.
3. Distortion Claim
Prices deviate systematically from competitive benchmarks due to structural changes in exposure and information flow. The distortion claim is the empirical core. Only this claim requires statistical proof. The incentive claim establishes motive. The information claim establishes mechanism. The distortion claim tests whether the mechanism produces measurable market-level effect.
Keeping the three claims analytically separate does more than prevent methodological confusion — it makes the framework robust to partial evidence. An opponent who disputes the distortion claim cannot simultaneously discredit the incentive or information claims. Each stands on its own foundation. Each falls only under its own evidentiary standard.
III. Economic Framework Stack
Five frameworks contribute distinct analytical layers. No single framework carries the argument—the claim emerges from their interaction. Each framework maps to one or more runtime metrics defined in Section V.
1. Two-Sided Platform Economics → Exposure Ratio, Dual Rate
Brokerage and portal integration increases the probability of internal buyer–seller matching. When both sides of a transaction route through the same platform, the platform captures value that would otherwise distribute across competing intermediaries. Integration raises internal match probability and reduces competitive pressure that normally disciplines pricing.
2. Vertical Integration (Industrial Organization) → Routing Dependency Score
Control over listing exposure and buyer traffic creates the structural capacity to shift order flow internally. Vertical integration does not require active diversion to alter outcomes—structural routing advantages produce the same effect through probabilistic friction. The Routing Dependency Score in Section V captures the degree to which buyer lead flow concentrates inside the integrated platform.
3. Information Asymmetry Theory → HHI, Spread Deviation
DOM and price history suppression is the operative mechanism in the current Compass-Redfin architecture, and the most likely mechanism in equivalent platform structures elsewhere. Buyers cannot estimate seller urgency without DOM. Buyers cannot assess pricing trajectory without price drop history. Both signals are inputs to the Nash bargaining model’s outside-option estimation. Removing them does not hide the property—it hides the competitive context around the property. Researchers applying this framework should identify which specific signals the platform under analysis suppresses and document that suppression profile in the local application section.
4. Nash Bargaining Model → Spread Deviation, Variance Index
Final sale price depends on both parties’ perceived outside options and their beliefs about competitive intensity. When listing marketing suppresses DOM and price history, buyers lose the signals they rely on to estimate seller urgency and market depth. Without those signals, buyers cannot tell whether a property has sat unsold for 90 days or listed yesterday, whether the seller has already cut the price twice, or how many competing buyers are active. Buyers who cannot assess competitive context calibrate offers conservatively — they widen their perceived outside options by treating the information gap as evidence of seller flexibility rather than seller strength. Meanwhile, sellers who believe platform distribution will generate internal buyer flow overestimate the competitive pressure working in their favor. The Nash bargaining solution shifts toward the seller’s stated ask in the short run — but realized prices decline because buyer offers anchor lower in the absence of urgency signals. The net effect in cooling markets is negative SpreadDeviation: integrated listings clear below predicted comp values despite the seller’s belief that exclusive marketing commands a premium.
5. Principal–Agent Theory → Dual Rate, Routing Dependency Score
When dual capture probability increases, the agent’s expected marginal revenue from internal routing increases. That shift moves the agent’s optimization frontier toward internal matching even absent intentional diversion. The mechanism operates through incentive geometry, not behavioral choice. Whether agents act on that incentive is an empirical question; that the incentive reshapes the optimization frontier structurally is not.
Together, the five frameworks identify the same distortion pathway from five independent theoretical directions. Two-sided platform economics establishes the integration incentive. Vertical integration theory establishes the routing capacity. Information asymmetry theory identifies the operative mechanism. Nash bargaining theory predicts the price effect. Principal-agent theory explains why individual agents reinforce it without coordination. Convergence across all five strengthens any finding the runtime metrics produce.
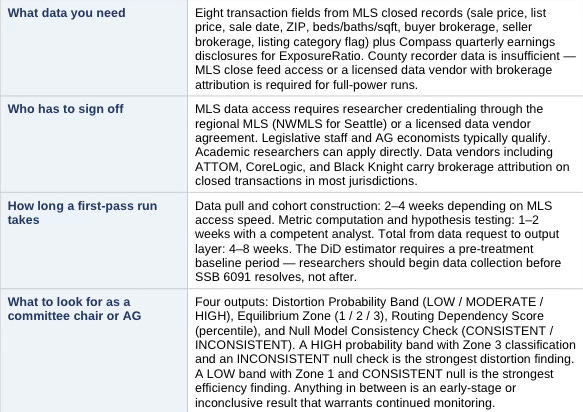
IV. Required Input Specification (Upload Layer)
The framework is designed to run under data suppression conditions. Compass, Redfin, and Rocket will not voluntarily produce internal match rates, buyer routing statistics, or DOM data for platform-exclusive listings—DOM suppression is the mechanism under study. Its absence from the data is the data. The framework is therefore structured around a minimum viable dataset derivable from MLS closed transaction records and quarterly earnings disclosures, with optional enrichment fields where available.
Cohort Definition — What the Integrated Cohort Is and Is Not
Compass listings fall into three categories with distinct information profiles. The framework targets only the suppressed-information categories. Treating all Compass listings as the integrated cohort conflates platform-mediated transactions with standard brokerage activity and weakens the signal.
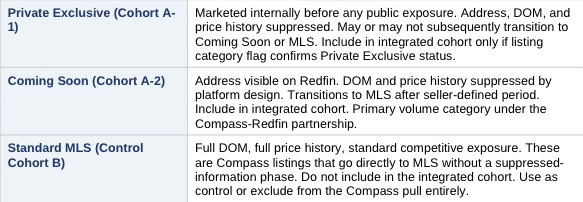
The integrated cohort is Compass listings with observable suppression markers—not all Compass listings. Researchers must apply the listing category flag to partition the Compass pull before computing any metric. A Compass listing without a Private Exclusive or Coming Soon flag belongs in the control cohort or is excluded, not in Cohort A.
Correct listing category flagging is the single highest-leverage data quality step. Misclassifying Standard MLS Compass listings into Cohort A dilutes the suppression signal, reduces metric sensitivity, and weakens every downstream hypothesis test. Data teams should build a QA check that confirms every Cohort A record carries a Private Exclusive or Coming Soon flag before any metric computation begins.
Minimum Viable Dataset — Eight Fields
The following eight fields are sufficient to compute DualRate, HHI, SpreadDeviation, and VarianceIndex. All are present in MLS closed transaction records. County recorder data does not include brokerage attribution and is insufficient as a standalone source for this framework.
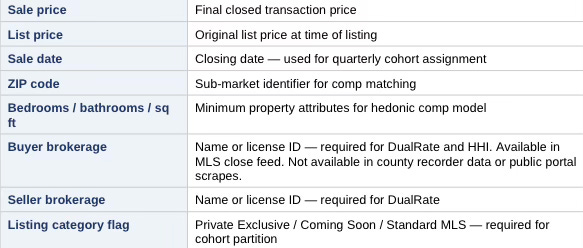
Buyer brokerage is the critical field. Public portals suppress it. County recorder filings do not include it. MLS-level close feed access or a licensed data vendor with brokerage attribution is required to compute DualRate and HHI at full power. Researchers who cannot obtain MLS access operate in a reduced-power configuration — see Data Access Scenarios below.
Data Access Scenarios
The framework produces different metric sets depending on data access level. Researchers should identify their scenario before beginning data collection.
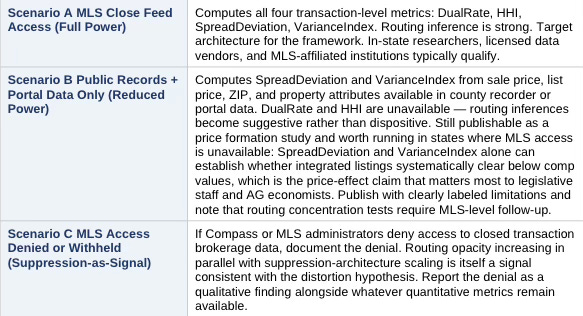
Scenario A is the design target. Researchers running the Seattle application should obtain NWMLS close feed access or work with a licensed data vendor providing brokerage attribution on closed transactions. Researchers in other jurisdictions should identify the equivalent MLS data access pathway before committing to a full framework run.
ExposureRatio — Public Earnings Data
ExposureRatio requires a count of Coming Soon and Private Exclusive listings relative to total active listings. Compass publishes Coming Soon and Private Exclusive listing counts on quarterly earnings calls. Reffkin cited the 500,000 listing projection publicly on the Q4 2025 call. Researchers derive the numerator from Compass earnings disclosures and the denominator from MLS active listing counts. No platform cooperation required. Where Compass does not break out listing-category counts by jurisdiction, researchers should use the national figure as a ceiling estimate and note the limitation.
DOM Suppression — Observed Absence as Evidence
DOM is suppressed by design on Redfin for Compass Coming Soon and Private Exclusive listings. Researchers cannot obtain DOM for these listings from Redfin. The correct analytical treatment is not to flag DOM as a missing variable but to document the suppression as an observed event. For the minimum viable dataset, researchers note: DOM data unavailable for Cohort A listings by platform design. That observation directly supports the information asymmetry mechanism in Section III — report it as a qualitative finding alongside the quantitative metrics.
Routing Dependency Score — Scenario-Dependent Configuration
Under Scenario A (MLS access), the Routing Dependency Score runs on three z-score components: DualRate delta, HHI delta, and ExposureRatio. Under Scenario B or C, DualRate and HHI are unavailable and the score reduces to a single-component ExposureRatio estimate, reported explicitly as a lower bound. Researchers must state their data access scenario in the methods section and label the Routing Dependency Score accordingly. Cross-metro comparisons should only aggregate scores computed under the same scenario configuration.
Optional Enrichment Fields
The following fields improve model precision when available but are not required to run the framework:
• Listing date — enables DOM calculation for Standard MLS cohort; strengthens comp matching
• Price reduction history and dates — enriches SpreadDeviation interpretation
• Number of offers received — directly tests competitive intensity hypothesis
• Buyer financing type — controls for cash-offer confound in SpreadDeviation
• Year built, lot size — additional hedonic comp controls
Market Controls
Required for baseline model construction and rate-environment adjustment. All are publicly available without platform cooperation:
• 30-year fixed mortgage rate, monthly average — Freddie Mac Primary Mortgage Market Survey
• Active listing inventory, monthly — MLS or Realtor.com/Zillow market data
• Median DOM, monthly, study jurisdiction — MLS market reports
• Sub-market segmentation: price tier or neighborhood classification — researcher-defined
• AVM vintage and lag adjustment methodology — see Section V, Baseline Note
Transparency Regime Variable
Researchers must assign a binary legislative environment variable before running the framework:

Where pending legislation exists, researchers should run the framework twice—once under each value—and report both outputs as a scenario band. Washington State SSB 6091, if enacted, would shift the Seattle application from TransparencyConstraint = 0 to TransparencyConstraint = 1. Wisconsin enacted concurrent marketing restrictions in December 2025, effective January 2027 — shifting Wisconsin jurisdictions to TransparencyConstraint = 1 on that date. Illinois reintroduced equivalent legislation in February 2026. The variable is not Washington-specific: any state statute, MLS rule with legal force, or regulatory guidance that restricts DOM/price history suppression or mandates concurrent MLS submission triggers a 0→1 shift. Researchers should document the specific statutory or regulatory basis for the assignment and the effective date.
With the eight minimum transaction fields, public earnings disclosures, and MLS-level close feed access, the framework runs at full power. Researchers who cannot obtain all three should identify their data access scenario before beginning collection, document what falls outside their reach, and label outputs accordingly. Partial data produces partial findings — acknowledged limitations strengthen rather than undermine a published result.
V. Runtime Metrics Layer
Five metrics constitute the analytical core. Each maps to a specific theoretical mechanism from Section III and a specific testable hypothesis from Section VI. Researchers compute each metric separately for the integrated platform cohort and the control cohort, then compare.
The table below gives non-quant readers a fast orientation. Full metric definitions, formulas, and computation instructions follow in the subsections.
Metric 1: Dual Representation Rate
Captures the degree to which single-agent dual representation concentrates within integrated platform transactions.
DualRate = (# transactions where buyer and seller share one agent or brokerage) / (total transactions)
Compute separately for: integrated platform listings, control brokerage listings, metro-wide baseline. Report pre-integration and post-integration periods separately. Structural drift requires persistence across at least two quarters at p < 0.05.
Metric 2: Buyer Concentration Index (HHI)
Captures the degree to which buyer-side brokerage representation concentrates within integrated platform listings, indicating internal routing.
HHI = Σ (buyer brokerage share_i)² where share_i = (transactions represented by brokerage i) / (total transactions in cohort)
Higher HHI values indicate reduced buyer diversity and heightened internal routing. Compute HHI separately for private exclusive / coming soon listings versus standard MLS listings in the same sub-market and time period. The delta between cohorts is the suppression-attributable concentration premium.
Metric 3: Spread Deviation
Captures systematic deviation of actual sale prices from predicted competitive benchmark prices.
SpreadDeviation = ActualSalePrice – PredictedBaselinePrice
PredictedBaselinePrice derives from the hedonic regression or AVM-adjusted comp model specified in the Baseline Note below. Negative SpreadDeviation on integrated listings—where integrated listings clear below their predicted comp value—provides direct evidence of impaired competitive process. The paper does not predict SpreadDeviation direction a priori for all markets; direction depends on local market conditions. In cooling markets with elevated inventory, the expected direction is negative.
Baseline Note: AVMs carry well-documented lag in transitional markets. In any market exhibiting rate-lock dynamics, anchored seller expectations, or rapid inventory change, researchers must document AVM vintage, apply a lag correction, and run sensitivity tests under alternative baseline specifications. Failure to address AVM lag directly invites the most common reviewer objection to price distortion claims.
Metric 4: Variance Index
Captures widening price dispersion as an early distortion signal, preceding any observable shift in mean prices.
VarianceIndex = Var(SpreadDeviation_integrated) – Var(SpreadDeviation_control)
Structural distortion tends to widen spread dispersion before shifting price levels. Some sellers in a distorted environment transact well; others underperform. Variance increase is the leading indicator. Mean price-level deviation, if present, follows variance increase with a lag. A Variance Index significantly greater than zero with no corresponding SpreadDeviation mean shift is consistent with early-stage distortion.
Metric 5: Exposure Ratio
Captures the scale of information-suppressed inventory relative to total market supply. Acts as the leading indicator for all other metrics.
ExposureRatio = (Private Exclusive listings + Coming Soon listings without DOM/price history) / Total active listings
Rising ExposureRatio precedes rising DualRate and rising HHI in markets where the distortion sequence is operating. Researchers should plot ExposureRatio as a time series before interpreting any other metric. A flat or declining ExposureRatio with rising DualRate suggests organic dual agency rather than platform-mediated routing.
The five metrics form a sequence, not a checklist. ExposureRatio leads. DualRate and HHI follow. VarianceIndex widens before SpreadDeviation shifts. Researchers who compute all five simultaneously and report each one against both the integrated cohort and the control cohort will have the full evidentiary basis the hypotheses in Section VI require.
VI. Testable Hypotheses
The framework advances four testable hypotheses. Each connects a structural mechanism to a measurable metric from Section V. The hypotheses are independent—failure of one does not invalidate the others—but convergence across multiple tests strengthens the distortion claim.
H1: Dual Representation Drift
Platform integration increases the DualRate relative to the control cohort and the metro baseline.
Test: Post-integration DualRate minus pre-integration DualRate, compared against control brokerages over the same period. Persistence required across two or more quarters at p < 0.05. Drift that appears in one quarter and reverses does not support the structural claim.
H2: Exposure Suppression Effect
Listings marketed with DOM and price history suppressed show reduced buyer-source diversity relative to standard MLS listings with comparable property attributes. Address suppression, where present, represents an additional suppression layer but is not required for the mechanism to operate.
Test: HHI for suppressed-information listings versus HHI for standard MLS listings in matched sub-markets and time periods. The delta between cohorts is the suppression-attributable concentration premium. The paper specifies geographic and temporal bounds for the HHI calculation in the local application section.
H3: Bargaining Spread Shift
Integrated listings exhibit systematic SpreadDeviation relative to comparable non-integrated listings, after controlling for property attributes and rate environment.
Test: SpreadDeviation from predicted comp baseline, integrated cohort versus control cohort. In cooling markets, the predicted direction is negative—integrated listings clear below their comp-predicted value. The framework does not presuppose this direction in all market environments; researchers should state their directional prediction before running the test.
H4: Price Dispersion Increase
ZIP-level price variance increases for integrated listings relative to control listings in the same geographic market.
Test: VarianceIndex significantly greater than zero. Distortion manifests first in variance, not level. A significant VarianceIndex with no corresponding mean SpreadDeviation shift is consistent with early-stage distortion. A significant VarianceIndex with a corresponding mean shift confirms advanced distortion. Researchers should report both the VarianceIndex and its temporal relationship to mean SpreadDeviation movement.
The four hypotheses are independent but not equal. H1 and H2 test the routing mechanism. H3 and H4 test the price effect. Confirming the routing mechanism without confirming the price effect means the architecture exists but has not yet produced measurable harm at the market level. Confirming the price effect without confirming the routing mechanism requires an alternative explanation. The strongest distortion finding confirms all four, in sequence, across both cohorts.
VII. Counterfactual Design and Difference-in-Differences Estimator
Any distortion argument must answer a precise counterfactual question: what price would have cleared absent integration? The empirical design requires two cohorts and two time periods.
Cohort Construction
• Group A: Integrated platform listings, post-integration period
• Group B: Comparable non-integrated listings, matched on property attributes, sub-market, and transaction timing
Pre-integration versus post-integration comparison within Group A establishes the temporal baseline. Group A versus Group B comparison establishes the structural difference. Only statistically significant deviation that persists across both comparisons supports the distortion claim. Matching on observable attributes reduces omitted variable bias but does not eliminate it—researchers should specify matching variables and acknowledge residual noise from unobservable seller motivation.
Legislative Shock DiD (where applicable)
Where TransparencyConstraint shifts from 0 to 1 during the study period, researchers should construct a difference-in-differences estimator:
DiD = (Integrated post-enactment − Integrated pre-enactment) − (Control post-enactment − Control pre-enactment)
If distortion metrics compress post-enactment for integrated platforms but not for control brokerages, the DiD estimator isolates the integration mechanism as the driver. A service-quality advantage survives transparency legislation. An exposure-routing advantage built on DOM and price history suppression does not. Compression post-enactment confirms which type of advantage the data reflects. Researchers should apply this test regardless of which jurisdiction’s legislation provides the shock—the estimator is jurisdiction-neutral.
The counterfactual design is the framework’s primary defense against alternative explanations. Reviewers who argue that price differences between integrated and control cohorts reflect property quality, seller sophistication, or market timing must explain why those differences persist across both temporal and structural comparisons simultaneously. Matching on observables and requiring persistence across two comparison dimensions raises that evidentiary bar materially.
VIII. Structural Threshold Classification
Not all dual representation is structural. Individual transactions produce dual agency through organic buyer-seller matching without platform routing. The framework classifies markets into three zones based on DualRate and ExposureRatio, distinguishing organic from structurally elevated dual agency.
Researchers compute the DualRate and ExposureRatio for the integrated platform, compare against the metro-wide baseline, and assign the market to one of three zones:
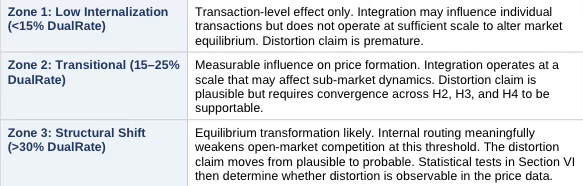
Crossing Zone 3 does not prove distortion—it establishes that the mechanism operates at sufficient scale to produce equilibrium-level effects. The distortion claim requires convergence of threshold classification with the statistical tests in Section VI. Neither alone is sufficient.
The 30% threshold requires theoretical grounding, not arbitrary assignment. Below 30%, competitive leakage dominates internal routing—enough transactions flow through non-integrated channels that market participants form price expectations from open-market clearing activity. Buyers and sellers encountering an integrated listing can still benchmark against a robust stream of observable, competitively-cleared comparables. Above 30%, the expectation formation process changes. When nearly one in three transactions in a sub-market routes through an integrated platform, participants begin to treat internal matching as a normal market condition rather than an anomaly. Bargaining-weight perception shifts: sellers can no longer confidently assume that withholding concessions will attract an outside buyer, because the observable frequency of outside-buyer transactions has declined to a level where that assumption loses empirical support. At this threshold, the integrated platform’s routing behavior stops being a deviation from the market equilibrium and starts constituting part of it. The 30% figure is calibrated to this expectation-formation inflection, not to a specific commission or revenue threshold—researchers should test sensitivity by running the zone classification at 25% and 35% and reporting whether findings are robust to threshold variation.
Zone classification is a prerequisite for output interpretation, not a standalone finding. A market in Zone 3 with no confirmed hypotheses from Section VI indicates that routing has reached structural scale but has not yet produced detectable price effects — or that the study period is too short to observe them. Report the zone, report the hypothesis test results, and let the convergence between the two carry the analytical weight.
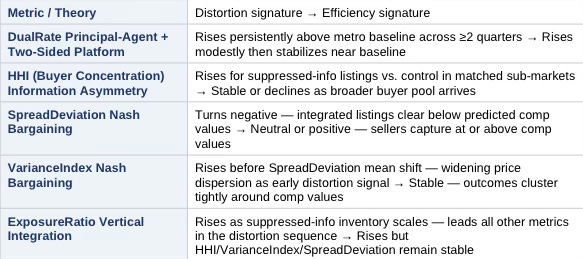
IX. Directional Sequence Detection
Platform-mediated distortion, when present, tends to manifest in a predictable sequence. The framework checks for this sequence as a convergence test. Observing the full sequence in order increases distortion probability. Breaking the sequence at any step is consistent with the null efficiency model.
The expected sequence under the distortion hypothesis:
1. ExposureRatio rises — platform accumulates suppressed-information inventory relative to total market supply.
2. DualRate rises — internal routing produces elevated dual representation within the integrated platform.
3. HHI rises — buyer-source diversity declines as leads concentrate with Compass listing agents.
4. VarianceIndex rises — price dispersion widens in integrated listings before any mean shift appears.
5. SpreadDeviation shifts negative — integrated listings begin clearing below predicted comp values.
Researchers should plot each metric as a time series and document the sequence of first significant movement. Full sequence in order supports the distortion hypothesis. Partial sequence or out-of-order movement requires explanation. Absence of sequence across all metrics supports the null model—that integration has not materially altered price discovery in the study market.
The sequence test is falsifiable. The framework commits to that standard.
Sequence detection works as a convergence accelerator: a researcher who has confirmed two hypotheses from Section VI but observes the full five-step sequence in order has stronger grounds for a HIGH distortion probability band than hypothesis confirmation alone would provide. Sequence order is diagnostic information independent of statistical significance thresholds.
X. Null Efficiency Model
The framework does not assume distortion. Platform integration may improve market efficiency rather than impair it. A brokerage-portal partnership could increase seller exposure, accelerate time-to-close, and reduce search friction for buyers—all outcomes consistent with a competitive market functioning normally or improving. The distortion hypothesis and the efficiency hypothesis generate distinct, testable metric signatures. The framework tests both simultaneously.
Under the null efficiency model, the expected metric signature is:
6. ExposureRatio rises — platform scales suppressed-information inventory, consistent with both hypotheses at this step.
7. DualRate rises modestly — some organic dual-agency increase is expected as platform matching improves; the null model predicts a modest, transient increase that stabilizes near the metro baseline rather than persistent drift above it.
8. HHI remains stable — buyer-source diversity does not decline, because improved platform exposure attracts a broader and more competitive buyer pool rather than concentrating leads internally.
9. VarianceIndex remains stable — price dispersion does not widen; outcomes cluster more tightly around predicted comp values as information quality improves.
10. SpreadDeviation is neutral or positive — sellers capture at or above predicted comp values, consistent with improved exposure generating competitive bidding.
The two hypotheses diverge most sharply at steps 3, 4, and 5. Rising ExposureRatio with rising DualRate is consistent with both models. The diagnostic signal lives in HHI, VarianceIndex, and SpreadDeviation. A market where ExposureRatio and DualRate both rise but HHI, VarianceIndex, and SpreadDeviation remain stable or improve is exhibiting the null efficiency signature—integration is expanding the market, not routing it internally.
Researchers must state which hypothesis they predict before running the framework and evaluate results against both signatures. A framework that tests only the distortion sequence without specifying the efficiency counterfactual is not falsifiable. Specifying both makes the test symmetric and the findings defensible.
The null efficiency model is not a concession — it is the framework’s evidentiary floor. Any distortion finding that cannot survive comparison against the null signature deserves less weight than one that clearly diverges from it at steps 3, 4, and 5. Publish the null signature alongside the distortion signature, and let readers see which one the data matches.
XI. Output Layer
The framework produces four outputs. Researchers report all four for each jurisdiction studied. The outputs translate the statistical results into structured findings that non-technical audiences—including legislators, enforcement bodies, and market participants—can interpret without statistical training.
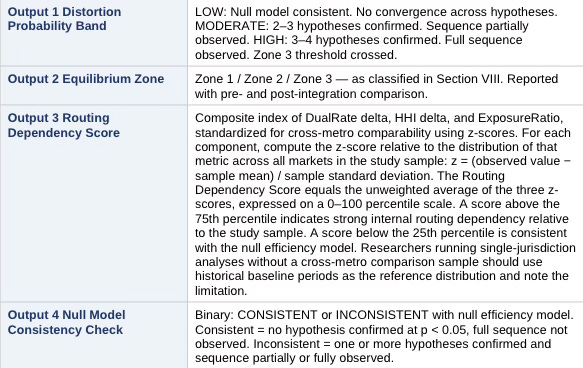
Outputs are jurisdiction-specific. A single application of the framework produces one set of outputs for one metro and one study period. Researchers running the framework across multiple jurisdictions should aggregate outputs into a cross-metro comparison table rather than averaging—each market occupies its own equilibrium zone and distortion probability band.
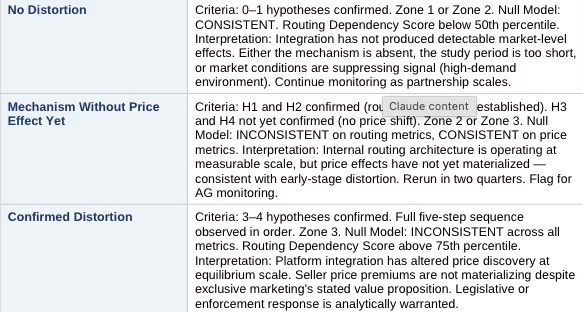
The four outputs together answer the question a non-technical audience needs answered: is platform integration changing how prices form in this market, and at what confidence level? The Distortion Probability Band gives the headline. The Equilibrium Zone gives the structural context. The Routing Dependency Score gives the mechanism measure. The Null Model Consistency Check gives the honest alternative. Report all four. Omitting any one weakens the analytical package.
Output Archetypes: Three Named Patterns
Outputs across jurisdictions will cluster into three recognizable patterns. Naming them reduces ambiguity when briefing non-technical audiences.
XII. Scope of the Framework
Precise scope boundaries protect the framework’s analytical credibility and prevent findings from being inflated beyond what the data can support. The framework evaluates structural shifts in price discovery mechanisms produced by platform-integrated brokerage activity operating through information-suppressed listing marketing.
The analysis addresses market microstructure, incentive alignment, and measurable price formation outcomes. Questions of legal liability, individual agent conduct, or seller welfare in specific transactions fall outside the analytical scope. Whether the identified mechanisms produce harm to any particular party requires analysis that extends beyond what market-level price dispersion data can establish.
The framework treats platform integration as a structural variable. The question it asks is whether that variable measurably alters the competitive process—not whether anyone intended that alteration.
The framework generates market-level evidence that can inform, but does not by itself decide, legal standards of materiality, fiduciary breach, or statutory violation. Researchers who want to extend findings into legal liability analysis, individual fiduciary duty claims, or seller-specific harm quantification should treat the framework’s output as a predicate, not a conclusion. What the framework establishes is whether the market-level mechanism operates. What it leaves for downstream analysis is whether that operation produces legally cognizable harm to identifiable parties.
XIII. Forward Predictions (Falsifiable)
In markets where platform integration meaningfully alters equilibrium, the following outcomes follow. Researchers should state these predictions before running the framework in each jurisdiction, then evaluate outcomes against predictions.
1. ExposureRatio increases materially within 12 months of integration or partnership announcement.
2. DualRate increases materially in targeted sub-markets within 12 months.
3. Buyer-source diversity, measured by HHI, declines for suppressed-information listings relative to control.
4. VarianceIndex rises before SpreadDeviation mean shift becomes observable.
5. Seller price premiums do not improve proportionally to the informational advantage exclusive marketing is sold as providing.
6. Where TransparencyConstraint shifts from 0 to 1, all metrics compress for integrated platforms but not for control brokerages.
If those outcomes do not materialize in the data, the distortion hypothesis weakens and requires revision. The predictions are falsifiable. The framework commits to that standard across all jurisdictions of application.
Stating predictions before running the data is the discipline that separates foresight analysis from post-hoc rationalization. Researchers who state predictions, run the framework, and publish both — regardless of whether the data confirms or contradicts the predictions — advance the analytical corpus. Confirmed predictions strengthen the distortion hypothesis for the next jurisdiction. Disconfirmed predictions identify the conditions under which the mechanism fails to produce the expected effects, which is equally valuable information.
XIV. Core Insight
Scale does not prove distortion. Mechanism proves distortion. Scale determines whether distortion shifts equilibrium.
Platform-integrated brokerage creates the structural capacity to internalize transaction flow. Information-suppressed listing marketing—specifically the removal of DOM and price history, the signals buyers rely on to estimate seller urgency and pricing trajectory—creates the conditions under which that internalization operates without competitive discipline. The Nash bargaining framework predicts that buyers who cannot assess competitive context will calibrate offers conservatively. The principal-agent framework predicts that dual commission incentives reinforce internal lead routing. Where platforms have characterized DOM and price history as harmful to seller value, that characterization suggests suppression is a strategic feature rather than incidental—a distinction the empirical tests are designed to assess.
Whether those mechanisms produce measurable, persistent, statistically significant deviation from competitive price benchmarks—at sufficient scale to shift market equilibrium rather than produce transaction-level noise—is what the runtime metrics determine.
Once internal routing exceeds competitive leakage, price formation no longer reflects open-market clearing but platform-mediated negotiation. That is an equilibrium shift, not a marketing tactic. Whether that threshold has been crossed in any given market is what the runtime metrics determine.
Run the framework. State the predictions. Report all four outputs. Publish the null alongside the distortion. Let the data answer.
Appendix A: Initial Application — Seattle / King County, Washington
Seattle provides the initial test environment for the framework. Appendix A demonstrates the protocol in operation — it does not constrain the framework’s scope.
Local Market Conditions
Seattle’s current conditions create a high-signal analytical environment. The market currently exhibits rate-lock equilibrium with buyers constrained by elevated mortgage rates and sellers anchoring to peak valuations; approximately 50% of transactions clearing below ask; rising inventory levels compressing seller leverage; and cooling negotiation dynamics across most sub-markets.
Cooling markets amplify the signal value of the framework’s metrics. When demand pressure is high and inventory scarce, information suppression matters less—buyers compete regardless of exposure breadth. When markets cool, transparency gains value, exposure breadth matters more, and bargaining power shifts become observable in the data. The rate-lock environment provides precisely the conditions under which structural exposure advantages produce detectable price effects.
Seattle’s current market conditions maximize the framework’s signal-to-noise ratio. Researchers applying the framework in high-demand, low-inventory markets should expect attenuated metric responses and note that the absence of a detectable signal in a hot market is not evidence of framework failure — it is evidence that market conditions currently dominate the suppression effect.
Legislative Environment
Washington State SSB 6091 proposes restrictions on pre-market exclusives and listing history opacity. The listing history opacity provision directly targets DOM and price history suppression—the operative mechanism in the Compass-Redfin architecture. If enacted, SSB 6091 shifts TransparencyConstraint from 0 to 1 for this application.
Publishing prior to SSB 6091’s disposition preserves the pre-treatment baseline. Post-enactment replication of this application using the DiD estimator in Section VII will test whether distortion metrics compress for integrated platforms but not for control brokerages—confirming whether the integration advantage was exposure-dependent or service-quality dependent.
The pre-treatment publication record is the baseline. Researchers who publish before a legislative shock resolves establish the evidentiary foundation that post-enactment replication requires. Waiting for the law to pass before publishing forfeits the pre-treatment data that makes the DiD estimator work.
Directional Prediction for Seattle
In the Seattle application, the framework predicts the following sequence: ExposureRatio rises as the Compass-Redfin-Rocket partnership scales Coming Soon and Private Exclusive inventory onto the Redfin platform. DualRate rises as lead routing directs buyer inquiries back to Compass listing agents. HHI rises as buyer-source diversity declines within the integrated listing cohort. VarianceIndex rises as price dispersion widens in integrated listings before any mean shift appears. SpreadDeviation turns negative in private-exclusive and coming-soon closes relative to comparable open-market listings—seller price premiums remain flat or decline despite the exclusive marketing program’s stated value proposition.
If that sequence does not materialize in the Seattle data, the distortion hypothesis for this application weakens. The framework’s falsification standard applies equally to the initial application as to any subsequent jurisdiction.