
Related works: AI Data Center Developers Are About to Disclose What State Power Approval Costs | The AI Data Center Authorization Price — A 50-State Baseline · Three Competing Governance Equilibria for AI Infrastructure · Why MindCast Is Filing a Public Comment with the Department of Energy · New York’s Data Center Moratorium · The Two-Ledger Data Center Bargain · The Federal-State AI Infrastructure Collision · The AI Infrastructure Power Stack
Critical references: The Model AI Infrastructure Authorization Code · The Data Center Authorization Market: A 50-State Regulatory Atlas
Executive Summary
America’s AI buildout still depends on chips, capital, power, and demand. But authorization — the accumulated legal and operational permission to site, interconnect, power, and energize a data center — has become the binding marginal input for an increasing share of projects. States have responded less by regulating the industry in the traditional sense than by standardizing the bargain, producing a functional competition among firms to win it.
Authorization now trades in a market with prices, buyers, sellers, and a visibly one-directional trajectory — and no common map of that market exists. Twenty-seven states now write data center law in twenty-seven vocabularies, hyperscalers negotiate against terms no instrument grades, and the national innovation consequences of next year’s legislative sessions remain unmodeled.
MindCast AI is publishing a six-part series that maps the authorization market end to end. One publication prices the sell side across all fifty states. One rates the buy side firm by firm. One prices the energy substance the bargain trades in. One renders a single statehouse at vote-by-vote resolution. One publishes the measurement code every other paper runs on. One converts the whole system into a forecast of the national AI innovation frontier through 2029. Authorization accumulates across four layers — federal transmission and permitting policy, RTO/ISO market and reliability rules, state utility and authorization law, and local and tribal consent — and the series prices all four.
Every analytical publication that advances forecasts carries falsifiable predictions with deadlines, falsifiers, and named settlement sources; the Code is the exception by design — a measurement instrument proves itself through adoption and application, not through a validation register. Every prediction sits timestamped on the public record, beyond quiet revision, and the full register is validated against public outcomes on two dates — July 2028 and July 2029. Readers who disagree with the analysis do not need to argue with it in the abstract; they can wait for it to settle.
Two anchor publications precede the series and establish its foundations: Three Competing Governance Equilibria for AI Infrastructure, which argued that conditional acceleration wins as the coordination equilibrium, and the DOE National Transmission Needs Study Comment, which supplied the federal measurement layer. The publications below extend those anchors into a complete operating map — and the measurement instrument itself, the Model Data Center Authorization Code, publishes in full as Part Two of this document.
Six Findings That Organize the Series
Architecture can wait; the insights the series defends should not. Six findings organize everything below, and each one is falsifiable in a paper of its own.
1 · State data center laws look like restriction and function like market design (Publications 1 and 5). Legislatures, commissions, utilities, and local governments are standardizing recurring entry terms, reducing the transaction cost of bespoke negotiation and producing a functional competition for scarce authorization. Across twenty-four states with approved large-load tariffs, the convergence centers on recurring financial terms — dedicated classes, cost causation, minimum-payment obligations, collateral, extended contracts, and exit protection — while a smaller frontier group adds verified flexibility, environmental performance, and community obligations.
Coase explains the first move: a standard contract is cheaper than fifty bespoke ones. Demsetz explains the second: the result resembles competition for a scarce franchise substituting for regulation of the market, even where no jurisdiction conducts a literal auction. Chicago accelerated — the price-theory tradition applied at legislative speed — in statute form. Interpretive confidence in the market-design reading: 80–88%.
2 · Permission is rationed, and power sets the ration (Publication 3). Variable clean resources can supply a large share of annual data-center energy before they can provide accredited capacity or firm hourly service. The physical ration therefore comes from the combined scarcity of deliverable energy, generation capacity, transmission, storage, and reliability headroom — not from renewable generation’s annual contribution alone — and it bounds the volume of new large-load authorization any jurisdiction or utility territory can support over a planning horizon. The constraint is physical before it is political — a structural claim held at 90–95%.
3 · Slots clear to posture, and governance capability is the currency (Publication 2). The rationed slots go to the firms that can meet the standardized provisions — collateral, clean-portfolio depth, verified flexibility, conduct — which makes governance capability competitive capital rather than compliance cost. Governments discount every developer promise by the firm’s record: a performed agreement in one jurisdiction lowers the discount every other jurisdiction applies, and a breach raises it everywhere at once. Interpretive confidence in the cross-jurisdiction discount mechanism: 75–85%.
4 · Restrictive-but-priceable law outperforms lenient-but-uncertain regimes (Publication 6). Developers finance certainty, not permissiveness: a demanding state with knowable terms attracts capital that a permissive state with volatile local politics cannot hold. The claim is the working hypothesis of the series’ forecasting paper, held at interpretive confidence 70–80% pending its register.
5 · Connected is not firm (Publication 3). Interconnection, access to energy, and capacity-backed firm service are three different products, and on July 27, 2026 the board of the largest U.S. regional grid operator directed a FERC filing proposing to separate them. Firmness is earned — through capacity, bilateral contracts, or enforceable curtailment — and a facility that earned none of it stands first in line for curtailment. The three-product separation is definitional; that regional rules will increasingly enforce it is forecast at 70–80% (AIAS-2).
6 · The price compounds across four ledgers, and the ratchet runs one way (Publications 1 and 4). Federal policy, RTO/ISO rules, state law, and local-tribal consent each price a different product, and the obligations compound across all four — Section III states the controlling rule. Meanwhile the trajectory runs one way: no verified binding jurisdiction in the T₀ dataset has moved toward unconditional acceleration during the measured period — an observed fact at T₀; its continuation is a register entry in Publication 1, not an assumption here.
Six findings, six papers, one market model. The rest of this document shows how each finding gets tested, what each paper delivers, and what a reader in any seat can commission when the public version raises a private question.
The Series at a Glance
One table orients the whole set: each publication owns one primary function of the authorization market, even where multiple instruments apply to the same project.
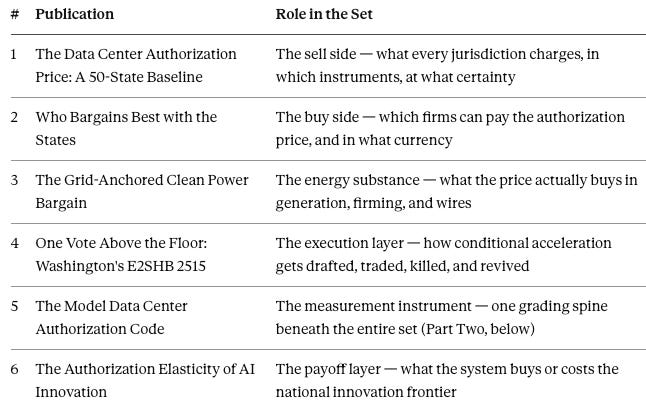
Read down the table and the market assembles itself: sellers, buyers, the commodity, the statehouse where terms get written, the ruler that measures them, and the national consequence.
What This Publication Is — and Is Not
Readers should treat this piece as the map of the map: an orientation to the series’ architecture, its headline claims, and its accountability structure — plus the one component every other paper depends on, published in full. Part One frames the market, the method, and the six publications. Part Two is the Model Data Center Authorization Code itself, so that when the fifty-state baseline and its successors land, the instrument they score against is already on the record. Nothing here substitutes for the papers; each carries its own evidence base, prediction register, and settlement terms, and each stands alone for the reader whose seat requires only one of them.
Reading paths by seat. Governors’ offices and legislative authors: Findings 1 and 4, then Publications 1, 4, and 6. Government-affairs teams at hyperscalers and developers: Findings 3 and 5, then Publications 1, 2, and 3. Utilities and commissions: Findings 5 and 6, then Publications 3 and 5. Investors and strategists: Findings 2 and 4, then Publications 1 and 6. Every path ends at Section VI, where each seat’s customized reports are named.
I. Authorization Became a Market — and No One Mapped It
Authorization became the binding constraint on AI infrastructure quietly, jurisdiction by jurisdiction, without any single actor deciding it would. State legislatures enacted large-load frameworks. Utility commissions approved tariffs with collateral, minimum-payment, and exit-fee machinery. Localities imposed moratoria and community benefit terms. Federal overlays layered on top. Each instrument priced one slice of one project in one place, and no instrument priced the whole.
Practitioners feel the result daily. A government-affairs lead comparing two states compares incommensurable regimes. A governor’s office asking where its state sits against competitors gets anecdotes, not a table. A legislator drafting a data center bill starts from a blank page when twenty-four states have already enacted precedent. Capital committees approve billions against authorization assumptions no one has stress-tested.
The physical constraint underneath the legal one makes the gap urgent rather than academic. Variable clean resources can supply a large share of annual data-center energy long before they can supply accredited capacity or firm hourly service, so the ration comes from the combined scarcity of deliverable energy, capacity, transmission, storage, and reliability headroom. Each jurisdiction and utility territory can support only a bounded volume of new large-load authorization over a given planning horizon, and projects compete for that available grid, generation, water, and political headroom.
Slots clear to the strongest bargaining posture. Finding 1’s standardization is what makes the competition legible: because the recurring term sheet converges even as clean-energy, water, labor, local-authority, and enforcement terms still vary, the contest shifts from discovering the terms to winning under them. The open question is who wins under it, in which states, at what price, and the series exists to answer it before capital commits.
II. Who Is Writing This, and Why the Method Is Different
MindCast AI is a predictive behavioral economics and game theory simulation firm. We build cognitive digital twins — computational behavioral models of the institutions, companies, and stakeholders in a contest — and simulate their decision-making through scenarios of constraint: what each actor does when the fiscal committee balks, when tariff terms tighten, when a rival concedes first, when a moratorium bill changes the bargaining table without ever passing. The output is not commentary on what already happened. The output is falsifiable foresight about what happens next, with deadlines and settlement sources, validated in public.
Neither parent discipline is predictive on its own, and the apparent paradox deserves a direct answer. Behavioral economics describes how real institutions deviate from rational-actor assumptions; game theory maps the strategic structure of a contest; both remain descriptive until they run inside a simulation. Fudenberg and Levine reframed equilibrium as the outcome of a learning process rather than a static solution, and Fudenberg’s later work pressed the discipline on the predictive completeness of its models — whether a theory forecasts, not merely explains.
MindCast carries that lineage into applied institutional forecasting through three additions. Cognitive digital twins supply the actor-specific initial conditions — a given institution’s incentives, constraints, and installed decision patterns — the way meteorology’s equations forecast weather only once fed observed atmospheric state. Simulation under constraint scenarios traces trajectories rather than hunting a single equilibrium, because the interesting question in a statehouse is never where a fixed game rests but how the game itself gets rewritten as pressure rises.
The prediction register supplies the third addition, and it does what neither parent discipline ever imposed on itself: every forecast carries a deadline, a falsifier, and a named settlement source, and the misses publish at the same level as the hits.
The engine earns that discipline in public before it is applied to statehouses. MindCast stress-tests the same simulation stack in arenas with immediate, un-fudgeable settlement — predictions published and timestamped on the record, then validated against the outcome — precisely because a forecasting method that cannot survive fast objective validation has no business advising on slow consequential decisions.
Traditional government affairs runs on relationship; the series runs on geometry. Relationships tell an operator who will take the meeting. Geometry — the structure of incentives, constraints, coalitions, and clocks — tells the operator what the meeting can produce, and the second question is the one capital actually needs answered.
III. The Four-Layer Governance Stack
Authorization accumulates across four layers of government, and each layer prices a different product. Federal transmission and permitting policy sets the national pace and the terms of access to federal process and federal land. RTO and ISO market and reliability rules — the layer most site-selection analysis skips — govern what no state statute reaches: accredited capacity, regional resource adequacy, wholesale market participation, curtailment sequencing, transmission deliverability, and the difference between firm and conditional service. State utility and authorization law sets the retail price: tariffs, financial assurance, clean-energy terms, siting conditions. Local and tribal consent sets the terms on which a community says yes at all.
The economics still reduce to quantity versus price — Congress contests how much gets built, the layers below contest the terms — but the price accumulates across all applicable, non-preempted layers. Within each regulatory domain, the most restrictive operative term controls; across domains, the obligations compound. A county can block zoning, an RTO can condition firmness, a state commission can assign retail costs, and a federal agency can control federal-land access — no single layer controls the whole authorization.
The regional layer stopped being theoretical while this series was in production. On July 27, 2026, the board of PJM — the largest U.S. regional grid operator and the system serving Northern Virginia’s major data-center concentration — directed staff to advance an Interim Resource Adequacy Service proposal for FERC review. Under the proposed framework, a qualifying new large load that has otherwise interconnected but lacks sufficient capacity coverage by June 1, 2027 would receive conditional reliability treatment and priority curtailment during shortage periods, while a regional Large Load Registry would hand states zone-level reliability data for their own tariff and flexibility policy.
FERC has not approved the framework, and this series treats it accordingly. The proposal’s direction, however, confirms the premise the publications share: connection is not firmness, firmness is earned through capacity, contracts, or enforceable flexibility, and Publication 3 develops the mechanism in full.
Contact mcai@mindcast-ai.com to partner with us on Predictive Game Theory AI in Law and Behavioral Economics. We specialize in predictive simulations for Complex Litigation, Innovation Economics, Geopolitical Risk Intelligence and Legacy Innovation. See more about MindCast series at our new website MindCast Corporate.
To test our predictive simulation AI system, in 2026 we simulated the Super Bowl and the World Cup. See 🏈 Super Bowl LX — AI Simulation vs. Reality | ⚽ The 2026 World Cup Final Simulation Validation
To deep dive on MindCast works upload the URL of this publication into any LLM (preferably Google AI mode) and prompt ‘reconstruct MindCast framework with three degrees of cited sub links.’ See Live-Fire Game Theory Simulators, Runtime Predictive Infrastructure.
IV. The Six Publications
Each entry below follows one skimmable pattern: the paper’s sharpest insight first, its governing equation second, its scope third, the questions only the full paper answers fourth, and the customized reports it powers last. Unless otherwise stated, equation inputs represent normalized indices rather than raw legal, physical, or financial units. A reader can stop at any layer and leave with something usable.
1 · The Data Center Authorization Price — A 50-State Baseline
The insight: strictness alone is the wrong variable to shop on. Two states with identical headline strictness present opposite commercial realities — a demanding-but-knowable Virginia against a permissive-but-volatile Indiana — because the commercial decision requires at least four outputs — strictness, price certainty, authorization friction, and the applicable regional and local overlays — and the last three move independently of the first. The commercial thesis is that developers can finance a demanding but knowable authorization price more readily than unresolved local veto risk — held at interpretive confidence 75–85%, and tested empirically in Publication 6.
AP(site) = Σₔ Sₔ(site) Sₔ is the normalized score of the most restrictive operative term within regulatory domain d. Within a domain, the strictest non-preempted term controls; across domains, the scores add.
Every AI infrastructure project now faces a distinct authorization price accumulated across state law, utility terms, local consent, tribal exposure, and regional and federal overlays. The paper maps all fifty states across three costs — energy, environment, public externalities — and four tempos: accelerate, bargain, pause, contested. Nine states carry comprehensive enacted floors, twenty-four hold at least one approved large-load tariff, one hundred–plus localities hold the bargaining floor, and no verified binding jurisdiction in the T₀ dataset moved toward unconditional acceleration during the measured period.
The full paper answers: which cells of the map are landmines because the terms are unwritten; where authorization tightens next, on a frozen ledger; and — for a governor’s office or legislative author — exactly where your state sits against the nine floors and twenty-four tariffs already enacted, provision by provision.
Customized reports: State Authorization Profiles · Multi-State Site Comparisons · Site-Specific Authorization Stacks · Authorization-Trajectory Reports · Governor’s Competitive Position Reports
2 · Who Bargains Best with the States — A Field Guide to Authorization Bargaining Positions
The insight: speed without governance capital manufactures the very moratoria, service denials, and hearing delays it then suffers from — and the guide tests two propositions sharp enough to falsify. First, that the national market clears only several dozen new large-campus authorizations annually, against disclosed demand several times larger. Second, that a principal’s home jurisdiction applies the largest conduct discount, because local institutions possess the deepest firm-specific record. Both are stated as model outputs with definitions and falsifiers in the paper, not as established facts — the slot-clearing proposition at 70–80%, the home-state discount at 65–78%.
Slot Odds ∝ Capability Bundle × (1 − Conduct Discount) Capabilities add; conduct multiplies — and the discount updates on the firm’s record in every jurisdiction at once.
Roughly $725 billion in 2026 hyperscaler capex — the four-company estimate frozen at the series baseline of T₀ = July 30, 2026, with later reporting already moving the figure toward $745 billion — is chasing that constrained pool, and firms compete with very different endowments. The guide rates principals, neoclouds, developers, and capital across seven capabilities — collateral capacity, clean-portfolio depth, governance conduct, demand credibility, optionality, federal alignment, and speed. Under frameworks like PJM’s, the same capabilities now purchase firmness itself, not just goodwill.
The full paper answers: the firm-by-firm ratings against the public record; each principal’s easiest and hardest states by name; and — for a state screening applicants — whose demand is real before scarce headroom commits.
Customized reports: Bargaining Position Scorecards · Competitor Authorization Benchmarks · State-Specific Bargaining Strategies · Governance-Capital Repair Plans · Applicant Credibility Reviews for Government
3 · The Grid-Anchored Clean Power Bargain — Powering AI Data Centers Through 2040
The insight: a facility can procure 100% annual renewable energy and still be the first load curtailed in a winter storm — because annual matching, hourly carbon-free performance, and capacity-backed firm service are three different products, and most clean-power debate collapses them into one. A mandate written without the resource-adequacy layer produces facilities green on paper and curtailment-first in practice — a structural claim held at 88–94%.
Firm Service = min( Interconnection, Deliverable Energy, Accredited Capacity ) The weakest of the three products sets service quality — connected-is-not-firm in one function.
The governing question is never clean-versus-grid; it is whether new load finances enough incremental clean generation, firming, and transmission to preserve reliability without shifting costs onto existing customers. The paper stages the answer to physics: disclosure and cost causation immediately, 80% annual additionality near 2030, hourly targets maturing through 2035–2040, with PJM’s proposed resource-adequacy framework as the first major regional test of the mechanism.
The full paper answers: what a legislature can bind next session versus what must wait for the build-out; which commitments a developer can actually deliver on which dates; and the model state standard, drafted.
Customized reports: Project Power Compacts · Connected-Is-Not-Firm Assessments · Clean-Power Deliverability Reviews · 2030–2040 Compliance Pathways · Model State Power Standards
4 · One Vote Above the Floor — What Washington’s E2SHB 2515 Teaches Every State Writing a Data Center Law
The insight: the country’s broadest data-center framework cleared its principal policy gates but failed when fiscal design, implementation costs, and unresolved coalition trades converged in Senate Ways and Means — and the failure generalizes into a drafting rule any state can use: carry tariff, queue, reporting, reliability, and core performance duties in the authorization vehicle, and move severable fiscal instruments through coordinated companion legislation.
P(Enactment) = P(Policy Coalition) × P(Fiscal Clearance | Policy Coalition) Fiscal clearance depends on the package the policy coalition produces. Bundling drives the conditional term down; modular drafting raises it — and with it the product.
Washington passed E2SHB 2515 through one chamber by a one-vote constitutional cushion; the Senate companion set the strict ceiling; and unresolved fee, tax, implementation, labor, and agency-cost questions exposed the entire regulatory package to a late-stage fiscal veto. Washington’s 2027 session becomes the framework’s first live validation, with enactment of a comprehensive or near-comprehensive law by June 2027 forecast at 70–80%.
The full paper answers: the vote-by-vote architecture of how the coalition assembled and where it broke; which provisions traded as levers and which formed the immovable floor; and what the 2027 successor bill looks like — before the session opens.
Customized reports: Bill Architecture and Provision Audits · Legislative Coalition and Vote Maps · Provision Bargaining Matrices · Committee and Session Foresight Simulations · Governor’s Enactment Strategies
5 · The Model Data Center Authorization Code — Part Two of This Document
The insight: a statute, a tariff, an executive order, a county ordinance, and an RTO rule imposing the same term are the same term — and once every clause scores on coverage, obligation, and consequence, the “standard tier” turns out to be empirically real: a modal enacted template (20–75 MW class, 85–90% minimum take, 10–15 year terms, cost causation) that legislatures are converging on whether they know it or not. The Code doubles as a drift detector — when the modal template migrates, it registers before any single state’s news does. Confidence that the Standard tier is empirically real at T₀: 85–92%; its migration is forecast at AIAS-4.
Provision Strictness = 25 × ( 0.30 Coverage + 0.40 Obligation + 0.30 Consequence ) What the law requires outweighs how many facilities it reaches or how it punishes — obligation carries the largest weight by design.
Twenty-seven states are writing data center law in twenty-seven vocabularies — with more joining every session — and no common instrument grades them on one spectrum. The Code makes the model-code move for AI infrastructure: it strips away incompatible legal forms, preserves regulatory function, and scores every operative term on a common unit — the authorization price. Twelve provision families define the grammar of everything a data center law can say; each family carries lenient, standard, and restrictive tiers anchored to named enacted instruments; and statute, tariff, executive order, county ordinance, and RTO instrument all grade identically when they impose identical terms. The full Code follows below.
Part Two answers: what the modal enacted design looks like, so deviation becomes a choice rather than an accident; how a legislative office drafts against the standard tier; and how a GA team builds one national term sheet — varying parameters, not structures.
Customized reports: Authorization Code Profiles · Bill-to-Code Crosswalks · Model Bill and Tariff Drafting · Portfolio Compliance Matrices · Authorization Drift Monitor
6 · The Authorization Elasticity of AI Innovation — Forecasting the 2027–2029 Frontier
The insight: strictness enters a developer’s math twice, with opposite signs — once as cost, once as certainty — and the series’ working hypothesis is that the innovation-maximizing point on the spectrum is the standard tier, not the lenient one. If the hypothesis holds — interpretive confidence 70–80% pending the paper’s register — the legislature that enacts the modal template does more for national AI capacity than the one that waives everything.
Throughput(state) = Headroom × Certainty × Conversion × Energization — summed across statesStrictness enters twice with opposite signs, as cost and as certainty, and the working hypothesis holds ∂Throughput/∂Strictness positive through the Standard tier.
America’s AI trajectory through 2029 will be set less by chip supply than by what thirty-plus state legislatures do in 2027. The paper forecasts national capacity under three scenarios — standardization, fragmentation, bifurcation — scoring every session outcome against the Code and converting strictness, price certainty, and authorization friction into energized-gigawatt throughput, with a register keyed to primary observables: megawatts contracted and energized, queue-to-service conversion, announced-to-realized capex.
The full paper answers: which named 2027 sessions move national capacity most; the probability on each scenario; and — for federal audiences — the fragmentation case for performance standards, stated in gigawatts rather than rhetoric.
Customized reports: State Authorization Throughput Forecasts · Legislative Scenario Impact Reports · Portfolio Deployment Forecasts · Fragmentation and Bifurcation Reports · Governor’s Innovation-Capacity Reports
Six insights, six instruments, thirty reports — and one dependency structure that determines the release order, laid out next.
V. How the Set Fits Together, and When Each Lands
The publications divide one market into its working parts, and the Code (Part Two) is the shared instrument. Publication 1 scores the sell side against it; Publication 2 scores the buy side; Publication 3 supplies the energy substance the bargain trades in; Publication 4 shows the bargain being written in a live legislature; Publication 6 converts the whole system into a forecast of what it produces.
Release order follows the dependency. The umbrella and the Code launch together. The fifty-state baseline follows, then the field guide as its paired companion on the same frozen baseline, then the clean-power deep-dive, then the Washington case study after the November 2026 elections and before the 2027 session. The elasticity forecast closes the arc once the 2027 legislative calendar gives its branch points dates.
Accountability runs on one structure across the set. The series operates on a frozen baseline of T₀ = July 30, 2026, with a single instrument-change ledger; every forward claim sits timestamped on the public record — beyond quiet revision — with a confidence band, a deadline, a falsifier, and a named settlement source; event probabilities and interpretive confidence never pool; and the master register is validated against public outcomes on two dates — July 2028 and July 2029 — with misses published at the same level as hits. A prediction that cannot lose is not a prediction.
The umbrella stakes its own entries, and they cover what no single paper owns: series-level trajectories that cut across the publications. Paper-level predictions — Washington’s enactment odds, the ratchet, the standard-tier hypothesis — remain in their papers’ registers and are cited here, never restated.
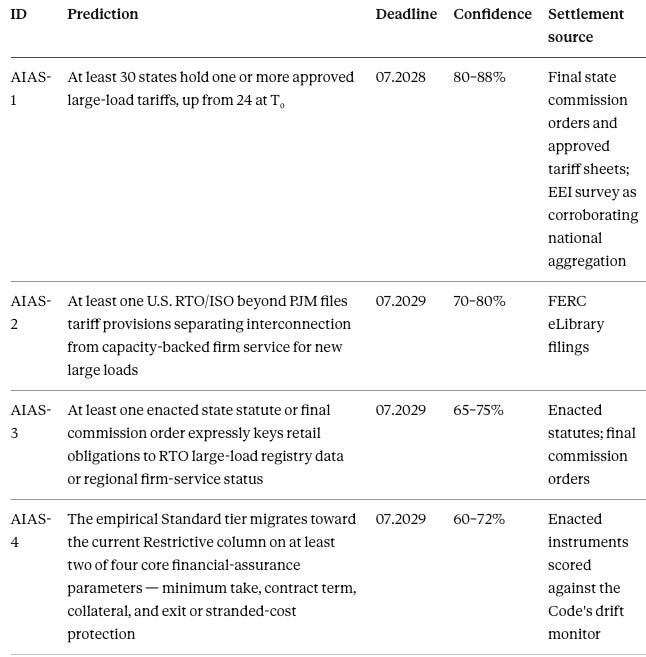
Falsification is symmetric: fewer than 30 tariff states, no second RTO filing, no cross-layer statute, or a Standard tier that holds or loosens each validates as a miss at the same prominence as any hit.
VI. Customized Intelligence Built From Each Publication
Each public publication establishes a reusable analytical instrument. Customized reports apply that instrument to a named company, project, jurisdiction, bill, utility territory, legislative session, or capital decision. The client does not receive a generic restatement of the publication; the report resolves a specific decision — where to build, what terms to offer, which promises to trust, how a bill will move, what power commitments are credible, or how authorization conditions change expected deployment.
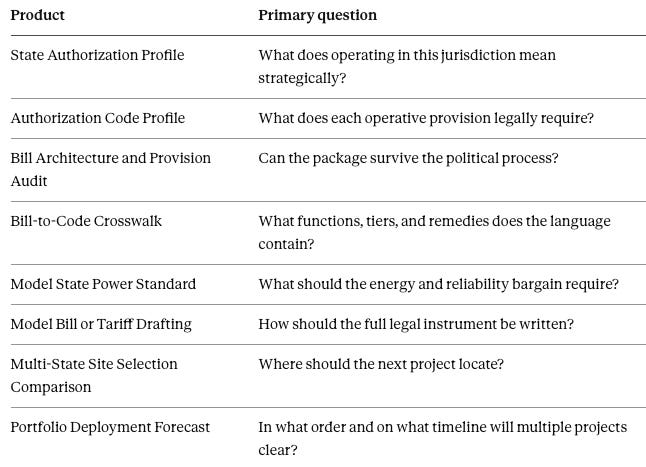
Where offerings touch the same project, they answer different decisions: Publication 1 selects and forecasts jurisdictions; Publication 4 models political passage; Publication 5 classifies and drafts legal instruments; Publication 6 forecasts deployment throughput. Eight products are easiest to conflate, so the table below states each one’s primary question before the full menu.
The six families below name every report and the decision it resolves — thirty products, five per publication, each one sentence long.
From Publication 1 — Jurisdiction Selection and Authorization Risk
State Authorization Profile Full Code-based assessment of one state, including strictness, certainty, friction, overlays, trajectory, and likely next move.
Multi-State Site Selection Comparison Selected jurisdictions compared across tariffs, financial assurance, power, environmental obligations, consent, incentives, and execution timing.
Site-Specific Authorization Stack A named site’s full obligation stack — state law, utility territory, RTO/ISO rules, county or municipal requirements, tribal exposure, and federal permits — with the most restrictive operative term identified in each domain.
Authorization-Trajectory Report Where a state’s authorization price moves over the next 12–36 months: pending bills, commission proceedings, utility filings, coalition pressures, and falsifiable branch predictions.
Governor’s Competitive Position Report How a state’s regime performs against selected competitors — which provisions improve project quality, which create avoidable friction, and where the state risks losing credible projects.
From Publication 2 — Firm Positioning and Counterparty Credibility
Authorization Bargaining Position Scorecard Confidential firm-level rating across collateral capacity, clean-power depth, governance conduct, demand credibility, geographic optionality, federal alignment, and execution speed.
Competitor Authorization Benchmark The client against selected hyperscalers, neoclouds, developers, utilities, or infrastructure funds competing for the same jurisdictional headroom.
State-Specific Bargaining Strategy What a named firm should offer, protect, trade, and refuse in a particular state — the concessions most likely to purchase certainty, speed, firm service, or political legitimacy.
Governance-Capital Repair Plan Which past conduct, unmet commitments, litigation positions, controversies, or disclosure gaps cause government actors to discount the firm’s promises — and which verifiable commitments repair the discount.
Applicant Credibility Review for Government Prepared for governors, utilities, commissions, or local governments assessing whether an applicant’s load forecast, financing, power plan, timeline, community commitments, and claimed flexibility deserve reliance.
From Publication 3 — Power, Firmness, and Performance
Project Power Compact A project-specific roadmap covering immediate cost-causation duties, resource procurement, annual additionality, hourly performance, storage, deliverability, flexibility, fallback supply, reporting, and enforcement milestones.
Connected-Is-Not-Firm Assessment Whether a proposed facility holds interconnection, deliverable energy, accredited capacity, and capacity-backed firm service — or remains exposed to shortage curtailment, market purchases, and contingent supply.
Clean-Power Deliverability and Maturity Review Proposed PPAs, onsite generation, batteries, advanced nuclear, geothermal, and transmission rights classified by operational maturity rather than announcement value.
2030–2040 Compliance Pathway A project or portfolio’s current power position translated into feasible annual and hourly milestones, with infrastructure dependencies, delay branches, and enforceable safety valves.
Model State Power Standard Customized legislative or regulatory language for a state, utility territory, or RTO region covering cost causation, resource adequacy, clean additionality, firmness, telemetry, curtailment, reporting, and remedies.
From Publication 4 — Legislative Strategy and Bill Simulation
Bill Architecture and Provision Audit Section-by-section analysis showing which provisions form the authorization floor, which belong in the bargaining zone, which create fiscal exposure, and which may operate as poison pills.
Legislative Coalition and Vote Map Chamber-specific analysis of sponsors, committee gates, swing members, utilities, labor, environmental groups, local governments, tribes, developers, and fiscal actors, with confidence bands around likely support.
Provision Bargaining Matrix A protect–trade–reject matrix for each operative clause, with acceptable fallbacks, counterpart interests, amendment risk, and the coalition effect of each concession.
Committee and Session Foresight Simulation CDT foresight simulation of a named bill through hearings, substitutions, fiscal referral, floor action, second-chamber changes, conference, and executive review.
Governor’s Enactment Strategy A coordinated legislative, agency, utility, fiscal, tribal, and public-message plan for converting an administration’s data-center objectives into a passable, implementable package.
From Publication 5 — Drafting, Classification, and Compliance
Authorization Code Profile A complete leaf-level score of a state, tariff, bill, executive order, RTO rule, or local ordinance across all twelve provision families.
Bill-to-Code Crosswalk Proposed legislation against the Lenient, Standard, and Restrictive tiers — omissions, deviations, internal inconsistencies, and enforcement gaps.
Model Bill or Tariff Drafting Customized legislative, commission, utility-tariff, or local-ordinance language built from selected Code positions rather than copied wholesale from another jurisdiction.
Portfolio Compliance Matrix Which existing and planned facilities satisfy current and expected obligations across jurisdictions, and where expansion, incentive, reporting, or service risks arise.
Authorization Drift Monitor A recurring report tracking movement in the empirical Standard tier as statutes, tariffs, commission orders, RTO rules, and local instruments change.
From Publication 6 — Throughput, Scenarios, and Policy Impact
State Authorization Throughput Forecast How much proposed load moves from announcement to contract, authorization, interconnection, and energization under a state’s present and expected regime.
Legislative Scenario Impact Report Alternative bills or amendments compared on how strictness, certainty, friction, incentives, and local contestability affect expected investment and energized capacity.
Portfolio Deployment Forecast How authorization conditions across selected states affect the timing, probability, and sequencing of a national project portfolio.
National Fragmentation and Bifurcation Report Whether state divergence produces standardized development corridors, delayed regions, or separate high-certainty and high-friction markets — and what federal intervention could change.
Governor’s Innovation-Capacity Report Whether a state’s proposed regime is likely to increase credible development, merely attract speculative announcements, or suppress throughput through uncertainty and cumulative veto risk.
Cross-Publication Flagship Dossiers
A few client questions require more than one instrument, and the combinations are named: the Market Entry Dossier(Publications 1 + 2 + 5) · the Project Authorization Dossier (1 + 3 + 5) · the State Authorization Legislative Strategy Dossier (1 + 4 + 5 + 6) · the Hyperscaler National Portfolio Strategy Dossier (1 + 2 + 3 + 6) · the Governor’s AI Infrastructure Compact (1 + 3 + 4 + 5 + 6) · and the Full Authorization Intelligence Dossier, drawing on all six.
The product structure mirrors the series exactly — sell side, buy side, energy substance, execution, measurement, payoff — so every report remains visibly derived from the public framework a reader can inspect for free.
VII. How to Commission Customized Work
The publications are the demonstration; engagements are the product. Every paper shows the engine’s outputs on the public record — validated predictions, the fifty-state map, the Code. An engagement points the same engine at your question, through the customized reports in Section VI — commissioned singly, or combined into the flagship dossiers and larger engagements. Standing work adds the Authorization Regime Map at operational resolution — live jurisdiction scores, trajectory calls, and the recommended move, before capital commits. Customized reports are scoped as fixed-fee projects. Standing monitoring, recurring score updates, legislative simulation, and portfolio-level advisory work are available through retainers with separately scoped project modules.
Noel Le · Founder, MindCast AI, LLC · mcai@mindcast-ai.com Publications: mindcast-ai.com · Simulation practice: mindcast-ai-simulation.com
Appendix 1 — Source Register
Time-sensitive and original claims in Part One rest on the following sources, frozen to the series baseline of T₀ = July 30, 2026 unless dated otherwise.
Twenty-four states with at least one approved large-load tariff — Edison Electric Institute, Large Customer Projects and Tariffs survey (July 2026).
Nine comprehensive enacted state floors; one hundred–plus verified local moratoria; the ratchet finding — MindCast T₀ dataset and instrument-change ledger underlying Publication 1 (fifty-state baseline, v1.0, T₀ = July 30, 2026), with per-count inclusion rules stated in that publication.
2026 hyperscaler capital expenditure (~$725B at T₀) — four-company (Microsoft, Alphabet, Amazon, Meta) estimate as reported at the baseline date; Financial Times, 2026 hyperscaler capital-expenditure reporting (ft.com/content/dcf3873e-7b32-4a24-a90d-3bccf1d2c996) has since moved the estimate toward ~$745B, illustrating why the figure publishes frozen.
PJM resource-adequacy framework — PJM Board of Managers, Decisional Letter on CIFP Reliability Backstop Procurement and Connect and Manage (July 27, 2026); PJM Inside Lines, board-action summary; Utility Dive (July 28, 2026). FERC review pending; nothing herein assumes approval.
PJM governance proceeding — FERC Commission-Led Technical Conference, Docket No. AD26-7-000 (July 23, 2026); Statement of Principles Regarding PJM (January 15–16, 2026), signed by the National Energy Dominance Council chair and vice-chair and all thirteen PJM-state governors (energy.gov).
Washington legislative history — E2SHB 2515 (House passage 51–41; died at the fiscal gate) and SB 6171 (no floor vote), 2026 Regular Session records, Washington State Legislature.
Federal permitting and federal-land track — Executive Order 14318, Accelerating Federal Permitting of Data Center Infrastructure (July 23, 2025), 90 Fed. Reg. (July 28, 2025); DOE federal-site announcements (July 2025); CRS Report R48762.
Theoretical lineage — R. Coase, “The Nature of the Firm,” Economica 4 (1937): 386–405, and “The Problem of Social Cost,” Journal of Law and Economics 3 (1960): 1–44; H. Demsetz, “Why Regulate Utilities?,” Journal of Law and Economics 11 (1968): 55–65; D. Fudenberg & D. K. Levine, The Theory of Learning in Games (MIT Press, 1998); D. Fudenberg, J. Kleinberg, A. Liang & S. Mullainathan, “Measuring the Completeness of Economic Models,” Journal of Political Economy 130:4 (2022).
Authorization-slot throughput and home-state conduct discount — model outputs of Publication 2, published there with definitions (minimum campus size, unit of authorization, geographic coverage, duplicate removal, oversubscription estimation) and falsifiers; stated in this umbrella as hypotheses under test, not established facts.
Each citation above contains enough detail to verify the claim on its own, and the register updates only when the instrument-change ledger does.
Appendix 2 — Related MindCast Publications
The series extends a published corpus, and each prior work below supplies a specific framework the six publications build on. Every entry states its relevance so no reader needs to open it to follow this document.
Three Competing Governance Equilibria for AI Infrastructure — the series’ primary anchor: conditional acceleration as the dominant coordination equilibrium, the nested governance model, governance capability as competitive capital, and the twelve-entry TGE register resolving through July 2028. Presented at the AI Infrastructure Summit — presentation brief.
Public Comment — DOE 2026 National Transmission Needs Study — the federal measurement layer: net transmission burden during constrained hours, the seven-dimension commitment-quality screen, and three predictions in the federal docket resolving by July 2028.
New York’s Data Center Moratorium — the infrastructure reclassification, the “charge them, don’t pause them” position the states have since adopted, and the AIRC-III register.
The Two-Ledger Data Center Bargain — the behavioral mechanics beneath the bargain tempo: loss-aversion weighting, portable grievances, the Federal Acceleration Paradox, and the TLSM register.
The Federal-State AI Infrastructure Collision — the partial-federalization forecast — federal control of process, state control of place and cost — now visible in the PJM governance proceeding’s state filing-rights debate.
The Power Stack — the resource hierarchy behind deployment and the distinction between constraint-removal capital and choke-point capital, which Publication 3 extends into the firmness analysis.
Predictive Game Theory Meets the Era of AI — the methodological foundation: operationalizing Fudenberg with cognitive digital twins, the game-replacement framework Section II summarizes.
The Commerce Clause as America’s AI Advantage — the absorption-not-erasure preemption design informing how federal floors and state authority coexist across the four-layer stack.
The corpus and the series share one accountability structure: every register above is validated in public, on schedule, with misses published at the same level as hits.
PART TWO
The Model Data Center Authorization Code
The Standardized Provision Taxonomy, with Lenient-to-Restrictive Variations
Publication 5 of the AI Infrastructure Authorization Series · MindCast AI, LLC · Baseline freeze: T₀ = July 30, 2026
How to Use the Code
The document supplies one instrument for grading any state’s data center legislation along a single spectrum, in the tradition of model codes that translate incompatible state regimes into a common functional language: strip the legal form, keep the regulatory function, and score every clause on one invariant unit. Twelve provision families define the grammar of everything a data center law can say. Each family carries three tiers — Lenient, Standard, Restrictive — with the states currently occupying each band, and each leaf provision carries a canonical code so scores can always be reconstructed from raw statutory values.
Three companion uses follow directly. Legislative staff can draft against the Standard column and select deviations deliberately rather than by omission. Government-affairs teams can price a jurisdiction by reading its row positions. Analysts can grade fifty states on identical terms regardless of whether an obligation arrives as statute, tariff, executive order, or county ordinance.
§0 — The Normalization Rule: Score the Function, Not the Legal Form
Every provision, whatever its legal vehicle, is a price term in an authorization contract between the jurisdiction and the load. Identical price terms score identically whether they arrive as a statute, an approved utility tariff, an executive order, a commission rule, a binding local instrument, or an RTO/ISO instrument — tariffs, operating agreements, reliability rules, market rules, and FERC-approved service classifications all score by function, not vehicle. Form-blindness is the normalization: Ohio’s PUCO-approved tariff, Virginia’s enacted statute, and a proposed Michigan community-benefit mandate all reduce to the same three questions — who is covered, what must they do, and what happens if they fail.
Strictness measures the authorization price imposed on a project, not whether a policy is environmentally desirable or commercially predictable. Legal status, legislative tempo, price certainty, and authorization friction remain separate variables recorded outside the strictness score. A restrictive regime can offer high price certainty (Virginia); a lenient regime can offer none (a permissive state with unstable county politics). The code grades price; each state chooses its point on the spectrum.
The Standard tier is defined empirically, not normatively — the design the largest number of enacted instruments now share. Standard therefore migrates as the enacted record migrates, and the tier definitions below carry the T₀ freeze date for that reason.
§1 — The Grading Instrument
Each leaf provision receives three independent 0–4 scores. Raw thresholds, dates, percentages, and consequences remain in the underlying dataset so any score can be reconstructed and audited.
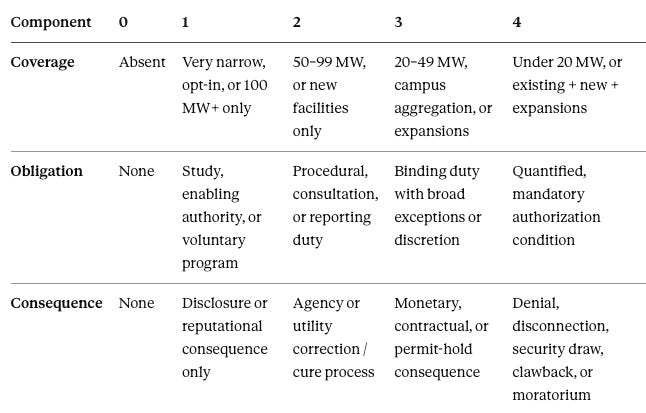
Provision Strictness = 25 × (30% Coverage + 40% Obligation + 30% Consequence), yielding a 0–100 scale per provision. Obligation carries the largest weight by design: a broad reporting rule should never automatically outrank a narrower quantified service condition.
Tier mapping. Lenient ≈ 0–33 · Standard ≈ 34–66 · Restrictive ≈ 67–100. The tier tables in §2 are the qualitative expression of the same bands, anchored to named instruments.
Aggregation rules.
Binding Strictness scores only enacted statutes, effective executive orders, approved tariffs, and binding local instruments. Frontier Strictness scores active bills and proposed rules separately. Failed, expired, or vetoed measures receive no Binding or Frontier score and may appear only as labeled Design Precedents.
Local Overlay records the strictest operative county or municipal layer for a candidate site. Authorization price accumulates across all applicable, non-preempted layers: within each regulatory domain the most restrictive operative term controls, and across domains the obligations compound — the state row is a floor, never a ceiling.
A state’s Authorization Profile reports financial, clean-energy, environmental, community, and local-control strictness separately, so unlike regimes remain visible rather than collapsing into one misleading average.
No incentive is neutral. A state scores as fiscally stricter only when it withdraws an existing subsidy, taxes consumption, or conditions a benefit on performance. An uncapped exemption is a negative price and scores Lenient.
One formula, three components, four aggregation rules — everything in the twelve families below reduces to them.
§2 — The Twelve Provision Families
Each family below states what it measures, lists its canonical leaf codes, and presents the three-tier ladder with the instruments anchoring each band at T₀. 🔶 marks a placement resting on pending rather than enacted language.
Family 1 — Scope and Coverage (SC)
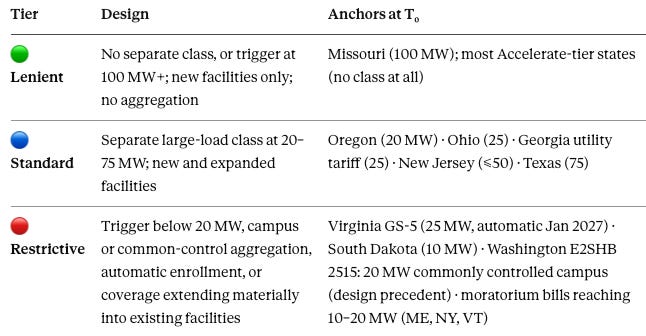
Scope determines how much load, and how many facilities, enter the regime at all — the coverage denominator every other family multiplies against. A regime with restrictive obligations and a 100 MW trigger governs almost nothing; a 10 MW campus-aggregated trigger governs nearly everything.
Leaf codes: SC-1 load threshold · SC-2 campus / common-control aggregation · SC-3 new, expansion, and existing coverage · SC-4 data-center-specific vs. all-large-load scope · SC-5 geographic reach.
Family 2 — Entry, Siting, and Authorization (EN)
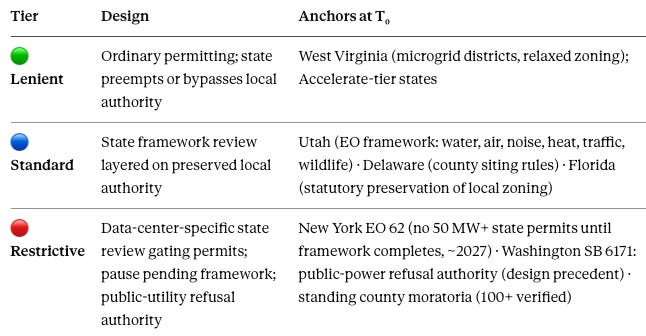
Entry provisions decide whether a project may enter ordinary permitting and obtain utility service at all — the family where a pause lives, and where the state–local allocation of veto power is written.
Leaf codes: EN-1 separate authorization requirement · EN-2 permit sequencing · EN-3 utility service discretion / refusal authority · EN-4 moratorium or pause · EN-5 state–local authority allocation · EN-6 federal land or facility authorization · EN-7 coordinated or expedited federal review.
Federal anchors: EO 14318 (July 23, 2025) — federal-land utilization, FAST-41 coordination, categorical exclusions; DOE’s four announced federal sites (binding federal instruments; site authorizations pending).
Family 3 — Queue and Interconnection (QU)
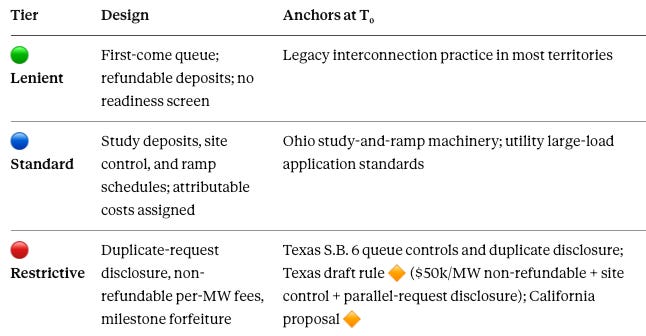
Queue provisions ration scarce grid headroom by proof of seriousness — the anti-speculation family. Phantom requests inflate forecasts, crowd out real projects, and stick ratepayers with study costs, which is why commercial-readiness screens spread fastest in the most constrained territories.
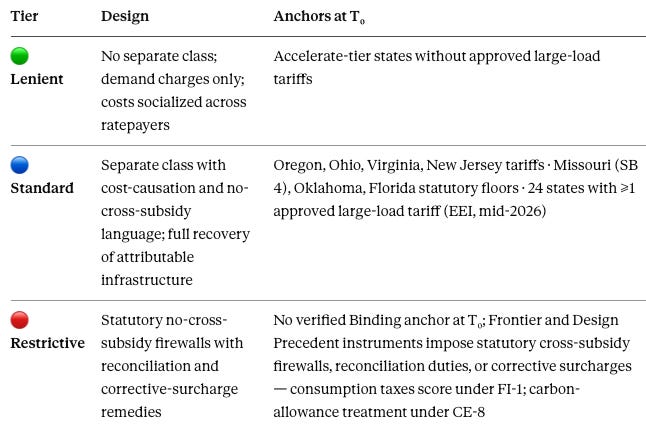
Leaf codes: QU-1 duplicate-request disclosure · QU-2 study deposits and fees · QU-3 site control · QU-4 commercial readiness · QU-5 attributable interconnection costs · QU-6 milestone loss and expiration.
Family 4 — Tariffs and Cost Causation (TF)
Tariff provisions answer the central distributive question: who pays the utility-system cost the new load creates. Cost-causation language is the single most standardized provision in the national record, and the family where bipartisan convergence is strongest.
Leaf codes: TF-1 separate tariff or rate class · TF-2 no-cross-subsidy rule · TF-3 full infrastructure cost recovery · TF-4 minimum demand charge · TF-5 generation vs. transmission allocation · TF-6 ramp schedule.
Family 5 — Contract Durability and Financial Assurance (FA)
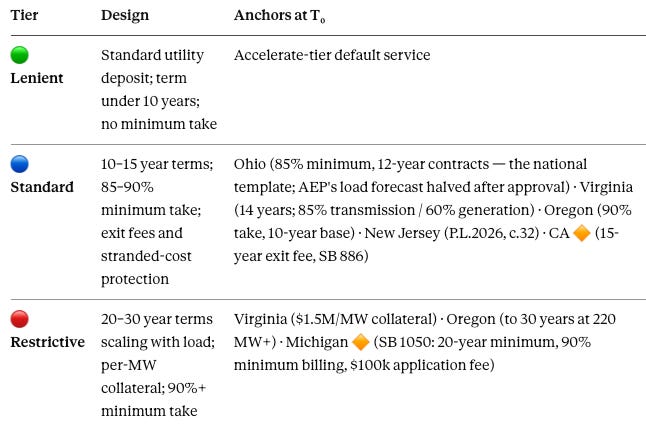
Assurance provisions keep the customer financially responsible after long-lived infrastructure is committed — the stranded-cost family, and the one that rations authorization by balance sheet.
Leaf codes: FA-1 minimum contract term · FA-2 minimum billing / take · FA-3 collateral or letter of credit · FA-4 exit fee · FA-5 stranded-cost protection · FA-6 decommissioning security.
Family 6 — Energy Supply, Resource Adequacy, and Decarbonization (CE)
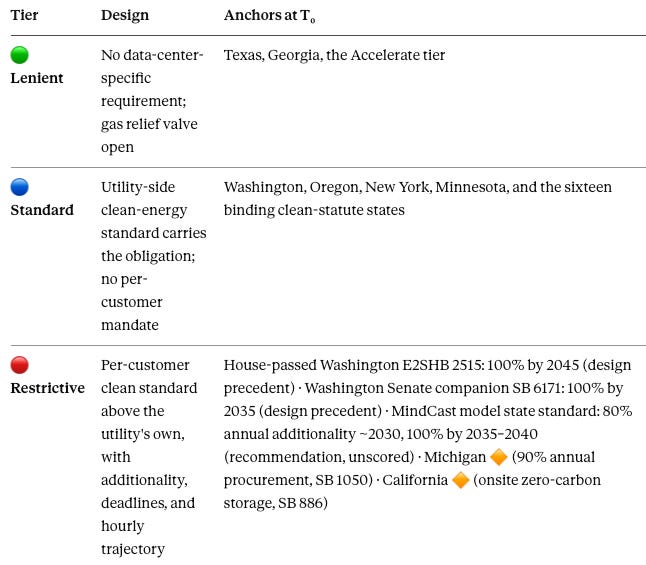
Energy-supply provisions determine whether new load adds clean and deliverable energy, secures sufficient resource adequacy, and qualifies for firm service — and on what clock. The family carries the sharpest analytical distinction in the code: annual matching proves procurement; hourly matching proves the power was there when the servers ran. A credible ladder imposes disclosure and additionality immediately while staging hourly performance through 2030–2040.
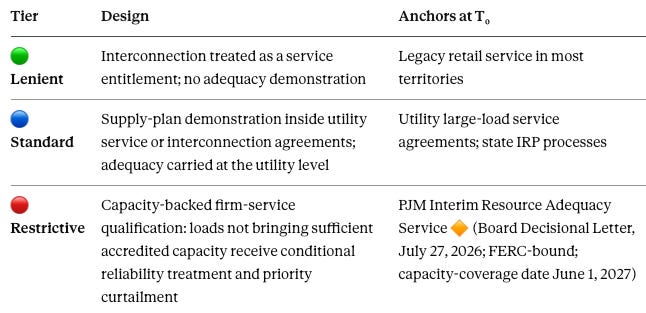
Leaf codes — sub-ladder CE-A, clean-energy performance: CE-1 clean share · CE-2 additionality (new resources only) · CE-3 compliance deadline · CE-4 annual matching · CE-5 hourly matching · CE-6 deliverability · CE-7 storage / clean-firm requirement · CE-8 carbon-market treatment (including carbon-allowance instruments such as Washington’s CCA treatment, design precedent). Leaf codes — sub-ladder CE-B, resource adequacy and firm-service qualification:CE-9 resource-adequacy coverage · CE-10 capacity-backed firm-service qualification.
A jurisdiction can be lenient on decarbonization and restrictive on firm-service qualification; the two sub-ladders grade independently and aggregate into one family score without hiding opposite policy positions.
Sub-ladder CE-A — clean-energy performance:
Sub-ladder CE-B — resource adequacy and firm-service qualification:
Family 7 — Reliability and Operations (RL)
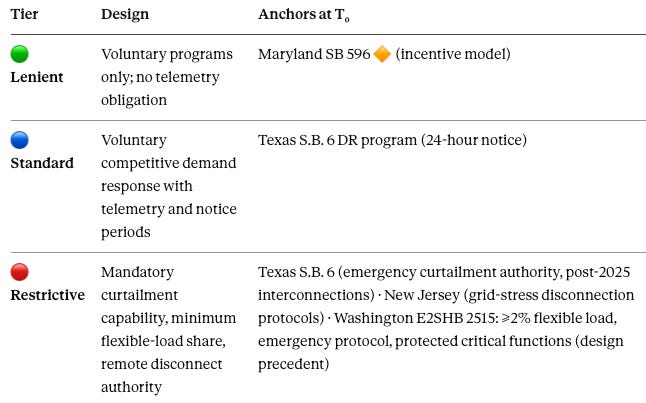
Reliability provisions define how the facility supports or yields to the grid under stress — the family where flexibility stops being a marketing claim and becomes a service condition. Telemetry is the gateway leaf: nothing else in the family is verifiable without it.
Leaf codes: RL-1 telemetry · RL-2 flexible-load capability · RL-3 demand response · RL-4 emergency curtailment · RL-5 remote disconnection · RL-6 critical-load exemption · RL-7 backup-power standard · RL-8 shortage-curtailment priority.
Regional anchor (Frontier 🔶): PJM Interim Resource Adequacy Service — capacity-short large loads face priority curtailment in shortages, with proposed compensation for verified performance when directed to reduce, subject to FERC approval.
Family 8 — Water, Air, and Environment (EV)
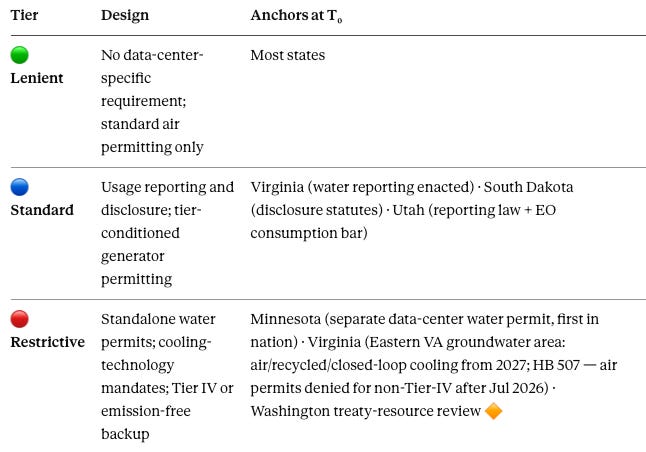
Environmental provisions price the facility’s physical-resource footprint through permitting — water first, because cooling demand collides with municipal and agricultural allocation, and treaty resources where they run.
Leaf codes: EV-1 resource assessment · EV-2 water-availability finding · EV-3 dedicated water permit · EV-4 cooling-technology requirement · EV-5 generator emissions · EV-6 refrigerants and air · EV-7 land, heat, noise, traffic, wildlife · EV-8 treaty resources.
Family 9 — Transparency and Public Process (TR)
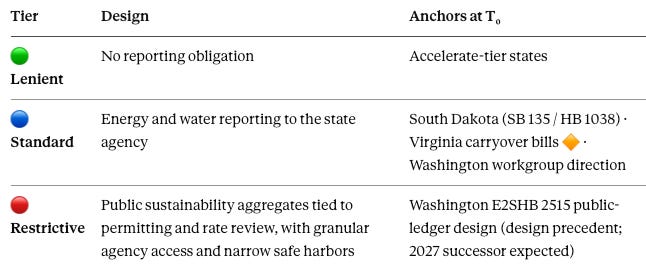
Transparency provisions determine what government and the public can verify without exposing protected facility details — the public-ledger family. Disclosure serves two costs at once: it prices the environment cost directly and the externalities cost indirectly, because reporting is how the public sees the ledger.
Leaf codes: TR-1 pre-development report · TR-2 annual operations report · TR-3 public aggregates · TR-4 granular agency access · TR-5 independent audit · TR-6 notice and hearing · TR-7 security / trade-secret safe harbor · TR-8 regional large-load registry.
Regional anchor (Frontier 🔶): PJM Large Load Registry — 50 MW+ at a single point of interconnection or within a one-mile radius; zone- and state-level reliability-impact data provided to states and distributors for flexibility and cost-allocation policy.
Family 10 — Community, Labor, Tribal, and Local (PB)
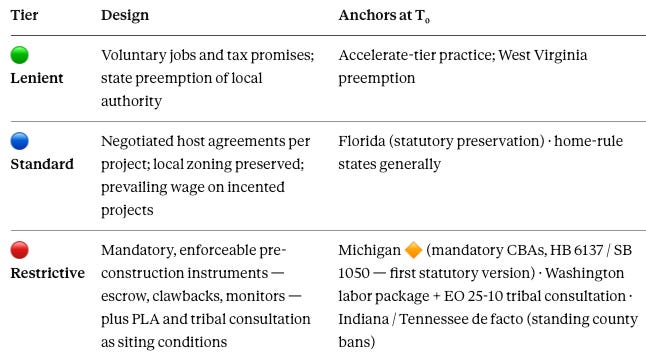
Community provisions allocate project benefits, voice, and construction standards — the consent family, where the local layer’s bargaining leverage becomes written obligation and where tribal exposure enters the code.
Leaf codes: PB-1 impact assessment · PB-2 community-benefit agreement · PB-3 host payment · PB-4 tribal consultation · PB-5 prevailing wage · PB-6 PLA / CWA · PB-7 apprenticeship · PB-8 local approval or rejection authority.
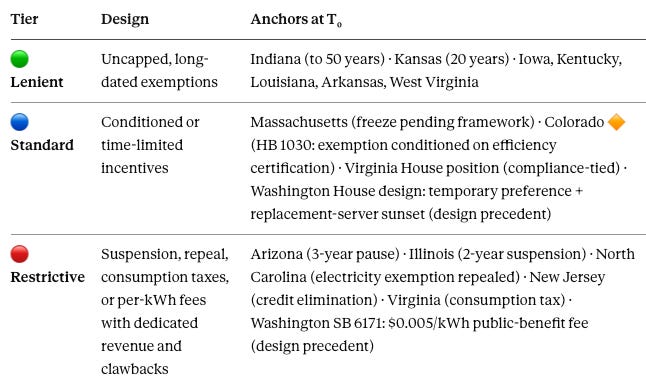
Family 11 — Taxes, Fees, and Incentives (FI)
Fiscal provisions decide whether public financial support remains unconditional or becomes reciprocal. The classification rule bears repeating here: no incentive is neutral, and a state scores stricter only when it withdraws, taxes, or conditions — an uncapped exemption is a negative authorization price.
Leaf codes: FI-1 consumption tax · FI-2 per-kWh public-benefit fee · FI-3 incentive duration · FI-4 performance conditions · FI-5 suspension or repeal · FI-6 revenue dedication · FI-7 clawback and sunset.
Family 12 — Enforcement and Remedies (ER)
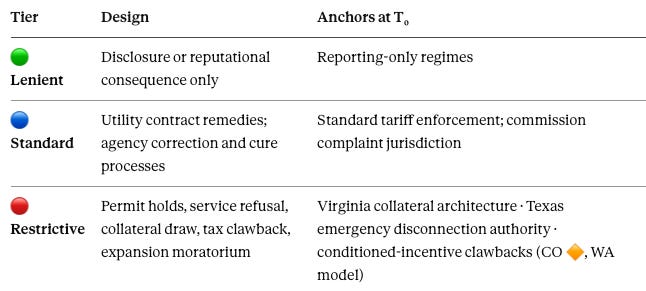
Enforcement provisions determine whether failure produces a consequence proportionate to the obligation — the family that converts every other family from aspiration into price. An obligation without a remedy scores its Consequence component at zero, whatever its text promises.
Leaf codes: ER-1 corrective tariff or surcharge · ER-2 expansion hold · ER-3 permit suspension or denial · ER-4 service refusal or disconnection · ER-5 security draw · ER-6 tax clawback · ER-7 administrative penalty · ER-8 reconciliation and cure.
§3 — Reading Rules
Five rules govern application of the code, and each one prevents a specific misreading.
Form-blindness. Score the function, never the vehicle. A tariff, a statute, an EO, and a county ordinance imposing the same term receive the same score.
Standard is empirical. The Standard column records the modal enacted template at T₀ — the 20–75 MW class, 85–90% minimum take, 10–15 year terms, cost-causation language. It migrates as enactments migrate; Michigan SB 1050’s fate is the single best forward indicator of whether Standard moves toward the Restrictive column (passage pulls the modal template within two sessions, 65–75%).
Strictness is not desirability. The code grades authorization price. It takes no position on whether any price is correct.
Obligations compound across layers. Authorization price accumulates across all applicable, non-preempted layers; within each regulatory domain the most restrictive operative term controls, and across domains the obligations compound. A state’s grade is a floor — the Local, Regional, and Federal Overlays must be scored per site before any state grade is used for a siting decision.
Three instrument categories, never mixed. Binding — enacted or approved instruments — score on the Binding ledger. Frontier — active proposals, marked 🔶 — score separately and never enter Binding Strictness. Design precedent — failed, expired, or historical language, labeled as such in the tables — illustrates a mechanism and receives no score on either ledger.
Applied together, the five rules make any two graded jurisdictions directly comparable — same unit, same ledgers, same categories.
§4 — State Grading Output Format
A state’s grade publishes as an Authorization Profile, never as a single number:
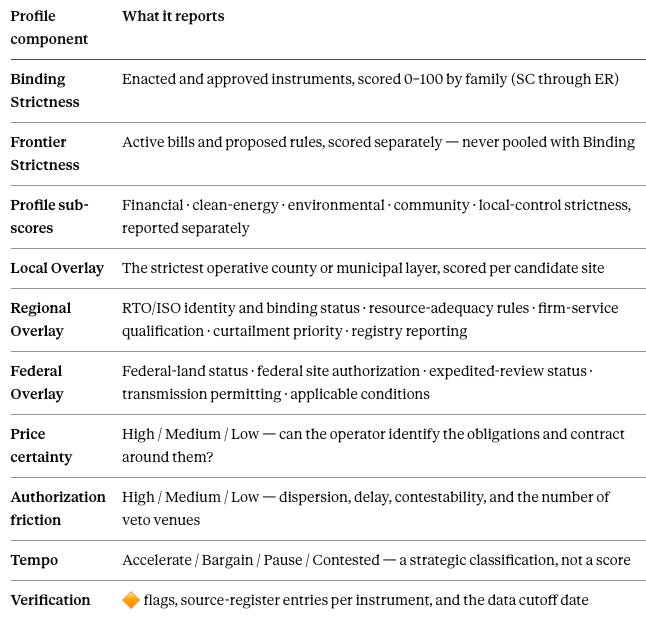
Two states with identical composite strictness can present opposite commercial realities — a demanding but predictable Virginia (high certainty, high cost) against a permissive but locally volatile Indiana (low certainty, high friction) — which is exactly why the profile reports the dimensions separately.
Appendix A — Crosswalk to the Three-Cost Architecture
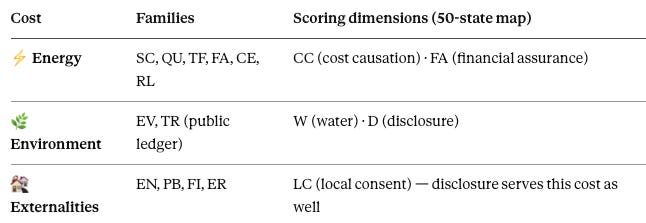
The twelve families roll up to the three costs every data center creates, preserving the reader-facing frame of the fifty-state baseline:
Appendix B — Provenance, Confidence, and Verification
The taxonomy consolidates two prior MindCast instruments: the three-cost, flexible-to-strict provision ladder from The Data Center Authorization Price (fifty-state baseline, T₀ = July 30, 2026) and the twelve-family canonical codebook with the 25 × (30/40/30) formula from the Washington strategy work. The merger preserves independent bargaining levers rather than collapsing them into a composite.
State anchors rest on enacted statutes, approved tariffs, effective executive orders, and binding local instruments verified through late July 2026; 🔶 marks pending, single-source, or aging placements requiring re-verification before external use. Confidence in tier placements: high (90%+) for jurisdictions with verified 2025–26 instruments; moderate (70–85%) for placements resting on pending bills. Session actions move weekly — re-verify any row before operational use, and log every instrument change to the ledger so tier migration is observed rather than inferred.
END OF ARTIFACT Model Data Center Authorization Code · Taxonomy v1.1 · MindCast AI, LLC · T₀ = July 30, 2026