


Companion to AI Data Center Authorization Bargaining Power — Ratings for Hyperscalers, Neoclouds, Developers, and Capital
Related works: AI Data Center Developers Are About to Disclose What State Power Approval Costs | The Authorization Market — Standardized Bargaining, Rationed Power, and the Competition to Build America’s AI Infrastructure | Three Competing Governance Equilibria for AI Infrastructure · Why MindCast Is Filing a Public Comment with the Department of Energy · New York’s Data Center Moratorium · The Two-Ledger Data Center Bargain · The Federal-State AI Infrastructure Collision · The AI Infrastructure Power Stack
Critical references: The Model AI Infrastructure Authorization Code · The Data Center Authorization Market: A 50-State Regulatory Atlas
I. Executive Summary 🎯
Every AI data center project in America now pays an authorization price — the accumulated legal and operational cost of permission to site, interconnect, power, and energize — and no two states charge it the same way. Twenty-four states have approved large-load tariffs. Nine carry dedicated enacted authorization floors — some statutory, some tariff-borne, some executive; the instrument type is recorded per state. More than one hundred localities hold binding pauses. The rest charge through silence, and silence is the most expensive price of all, because its terms get written after your capital commits.
Most readers arrive with one question — which states are strict — and the map answers it. But strictness is the wrong variable to shop on, and the paper’s core finding shows why: the strictest states keep winning the most bidders. Virginia demands $1.5 million per megawatt in collateral and holds the deepest data center market on earth. Texas mandates curtailment and drew 474 gigawatts of connection requests. Observed siting patterns are consistent with the reverse causal direction — capacity attracts load, and accumulated load induces stricter terms — and among legal variables, price certainty appears far more commercially decisive than nominal leniency, stated here at 75–85% interpretive confidence and tested directly in Publication 6.
Four findings anchor everything that follows. First, a Standard template already exists: the twenty-four tariff states converged on recognizably identical terms — 20–75 MW coverage, 85–90% minimum take, 10–15 year contracts — without coordinating. Second, the price moves in one direction: across the measured period, no state loosened an enacted term, and the year’s loudest restriction defeats removed proposed pauses without touching a single enacted one. Third, the real risk cells are not the strict states but the unwritten ones — California, Pennsylvania, Indiana, the tribal layer, and the accelerate belt — where terms arrive late, locally, and unbudgeted. Fourth, all of it is falsifiable: thirty-four predictions with deadlines and settlement sources let readers grade this paper in public through July 2028. Five headline the register.
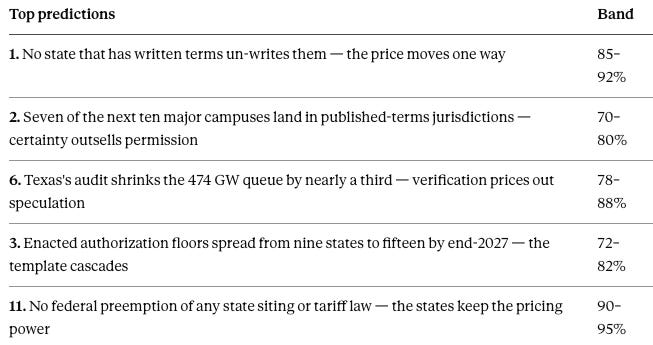
Each carries a deadline, falsifier, and named settlement source in Section XI; misses publish at the same level as hits.
Who This Is For, and Where to Start
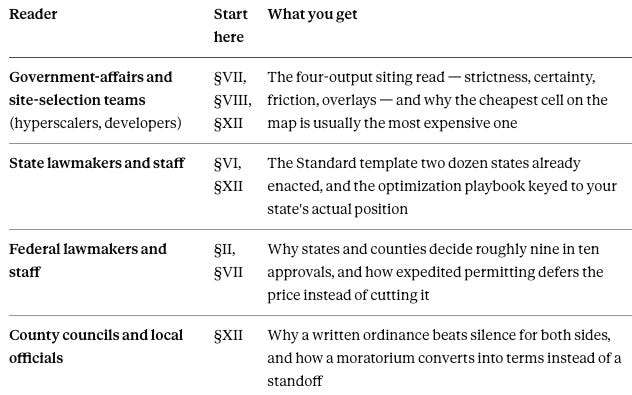
Three questions organize the paper for all four seats. Why do some states carry stricter laws and proposals than others? Sections 8 and 10 answer with a mechanism, not a mood: load causes law, grievances travel, and templates cascade. Why do hyperscalers choose some states over others? Section 8 prices the draw — speed-to-power first, certainty as the multiplier. How can a state optimize AI data center development? Section 12 answers with a playbook keyed to each state’s position, because the optimal move for Virginia is malpractice for Montana.
The document delivers the answers in reading order. Sections 2 through 5 set the architecture and deliver the fifty-state results, with the full evidence tables in The Data Center Authorization Market: A 50-State Regulatory Atlas. Sections 6 through 8 price the market. Sections 9 through 12 state the findings, run the forecast, freeze the register, and end where the audience acts: the optimization playbook by seat. The Data Center Authorization Market: A 50-State Regulatory Atlas — carries the full evidentiary layer for readers who want the receipts.
One sentence carries the thesis. The emerging American equilibrium is neither pause nor permission — it is authorization at a price, the price is knowable, and the firms and states that price it first will take the surplus from those that price it last.
II. How States Price Data Centers: Three Costs, Three Timing Strategies 🧭
Every data center creates three costs: energy (grid capacity, interconnection, stranded-asset risk), environment (water, emissions, land), and externalities on the public (ratepayer cost shifts, community disruption, the thin benefit line). No governance system disputes the costs. The three competing equilibria dispute only when the costs get priced along the build timescale:
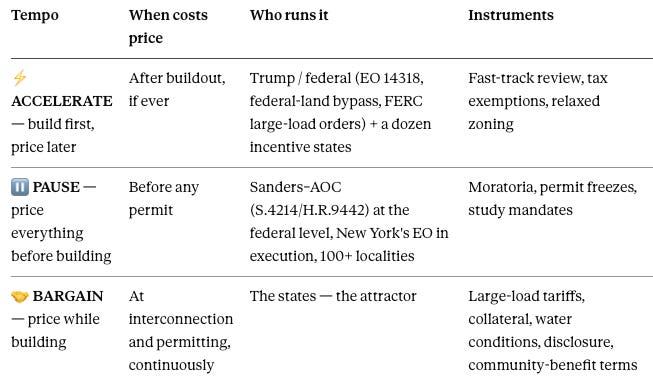
The bargain is the unique time-consistent tempo, and the bargain is winning: the pause threat sets the floor on conditions, the federal acceleration layer sets the ceiling on price, and both threats price the middle without being exercised.
Each tempo maps to a layer. Acceleration lives federally because federal permits were never the modal bottleneck — states and counties decide roughly nine in ten approvals. Pause lives in proposal form federally and in execution form locally, with New York the lone state-level exception.
The bargain lives in the states because states own the pricing instruments: tariff authority, water permits, and the police power localities exercise on their behalf. As of mid-2026, the Edison Electric Institute counts 24 states with at least one approved large-load tariff and several more pending (EEI large-load tariff tracker, May–June 2026); an industry tracker counting proposed tariffs puts the total at 51 approved and 26 proposed across 36 states and 60 utilities (March 2026 update).
MultiState counted more than 300 data center bills filed across 30-plus states in the first six weeks of the 2026 sessions alone, after 200-plus bills in 40-plus states in 2025.
The map below scores every state on which of the three costs it has priced, using five measurement dimensions that roll up cleanly: cost causation and financial assurance price the energy cost; water conditions and disclosure price the environment cost; local consent prices the externalities cost (disclosure serves both of the latter — reporting is how the public sees the ledger).
Each dimension is scored strict-to-lenient with a trajectory arrow. Buyer-facing polarity flips the same data into operator vocabulary: friendly means terms are written and priceable; landmine means terms are unwritten and opposition is unpriced.
The strictest non-preempted layer controls the site, so the state row is a floor, never a ceiling — county and municipal action now moves faster than state action, and the local layer is where most 2026 surprises originated.
One structural finding leads everything else: New York’s EO 62 (July 14, 2026) is the sole state-level permitting pause in force at T₀ — scoped to DEC applications not yet deemed complete, expressly excluding local permits; Texas joined post-freeze with a broader audit-gated instrument (the Post-T₀ Addendum) — yet the moratorium threat has done its pricing work in at least six states without being broadly exercised. Maine passed one and the governor vetoed it into an advisory council. New York passed one and the governor substituted her own narrower executive pause. Georgia’s died in chamber and resurfaced as county ordinances.
The pattern is consistent with the framework’s core claim — moratoriums are negotiating postures that resolve into conditional statutes. Precisely stated at T₀: one completed conversion (South Dakota, pause tabled and disclosure statutes enacted inside a single session) plus three active or adjacent pathways (Maine’s advisory council, New York’s EO-gated framework, Georgia’s utility-and-county migration), tracked prospectively from this baseline via the instrument-change ledger.
One measurement bridge completes the architecture. The series umbrella publishes the Model Data Center Authorization Code — twelve provision families, three tiers, one strictness formula — as the instrument every series paper scores against, and the five dimensions below are the baseline’s reader-facing roll-up of those families: cost causation and financial assurance carry the tariff, queue, and assurance families; water and disclosure carry the environmental and transparency families; local consent carries the community and entry families.
Leaf-level Code scores live in the underlying dataset; the roll-up keeps fifty rows readable. And because strictness alone misleads, every row also carries the two buyer variables the Code records outside the strictness score — price certainty and authorization friction — so the four outputs a siting decision actually requires (strictness, certainty, friction, overlays) stay separately visible throughout.
III. How the Baseline Was Built — and What It Cannot Claim 🔬
Unit of analysis: state floor × utility territory × locality × tribal/federal nexus — authorization cost accumulates across layers while the slowest binding layer controls timing, so no single state color can carry legal status, stringency, and buyer consequence at once. Table 3a (The Data Center Authorization Market: A 50-State Regulatory Atlas) separates them: observed fields (Floor, Util, Local, T/F) record instruments and their status; inference fields (Tempo, price certainty, authorization friction, Trajectory) record MindCast’s classifications, labeled as such and banded.
Limitations, stated plainly. The utility overlay is one-third unmapped (❔ cells) pending the tariff-to-state attribution pass; most rows rest on secondary sources pending the primary-source backfill (The Data Center Authorization Market: A 50-State Regulatory Atlas G); trajectory arrows are assigned at a single baseline and validate nothing by themselves; and all throughput or count claims derive mechanically from the tables under the check protocol in the Verification section. July 30, 2026 is frozen as T₀: every forward claim lives in the prediction register against this baseline, and the instrument-change ledger (The Data Center Authorization Market: A 50-State Regulatory Atlas F) — empty at T₀ by construction — is the instrument that converts assigned arrows into observed movement.
One evidentiary rule governs the entire baseline and deserves plain statement. Anchor states — the jurisdictions carrying the paper’s named instruments — are primary-verified against commission orders, session laws, and executive texts. Remaining rows are desk-grade classifications built from the EEI survey, the DELTa tariff database, MultiState tracking, and trade coverage, published at the confidence stated per row and marked 🔶 or ❔ where the record is pending or unmapped. An ❔ cell is itself a finding — “no verified instrument located” — not a defect awaiting repair. Rows harden as they are touched: national conclusions rest on the verified spine and the aggregate record, while leaf-level certainty for any single jurisdiction is the engagement product, produced when a decision requires it. Every credible fifty-state survey works this way; the baseline differs only in saying so.
The Regional Service Overlay
PJM does not belong inside any state’s strictness score, and the omission is deliberate. The RTO crosses thirteen jurisdictions and imposes a different kind of price: the terms on which regional firmness, capacity treatment, and shortage protection become available. Under PJM’s July 27, 2026 proposal, a new 50 MW+ load that brings no capacity remains connected but is curtailed first during shortages — a service condition no state statute sets and no state score captures.
The baseline therefore distinguishes four cumulative price layers: the state authorization price (this document’s scores), the local overlay (the strictest operative county or municipal layer), the regional service overlay (RTO/ISO capacity, firmness, and curtailment terms), and the federal overlay (permitting, transmission, and needs-assessment policy). A Virginia project faces Virginia’s tariff and siting terms plus PJM’s capacity and firmness rules. One does not replace the other, and a siting decision that reads only the state row has priced two of four layers.
The utility-territory column in Table 3a (The Data Center Authorization Market: A 50-State Regulatory Atlas) records state-jurisdictional tariff terms and remains distinct from this layer. Publication 3 develops the connected-versus-firm mechanism in full; the baseline prices the layer’s existence, not its physics.
IV–V. The Fifty-State Results: 31 Bargaining States, One Pause, and a Local Veto Layer 🗺️
Full state-by-state evidence lives in The Data Center Authorization Market: A 50-State Regulatory Atlas — and the paper carries its results here so the argument stays self-contained. At T₀, the fifty states classify as 31 Bargain, 1 Pause, 5 Contested, and 13 Accelerate — the bargain posture already holds three-fifths of the map and a larger share of its committed load. Nine states carry dedicated enacted authorization floors, arriving variously as statute, commission order, approved tariff, or executive instrument; nine more hold partial instruments; twenty-four states have at least one approved large-load tariff; and more than one hundred localities hold binding pauses that set the consent floor beneath every state regime.
Two structural results from the map carry the rest of the paper. Pause barely exists at the state level — New York’s completeness-gated executive order is the only statewide permitting pause, and Delaware’s territory-scoped interconnection pause its only commission analog — while the pause tempo thrives locally, which locates the real veto power at the county line. And no verified binding jurisdiction moved toward unconditional acceleration during the measured period: every verified change wrote terms, tightened them, or conditioned a benefit. Tables 3a and 3b in The Data Center Authorization Market: A 50-State Regulatory Atlas record the per-state evidence, the reading key, and the three-cost pricing scores behind both results. One convention travels into this article: 🔶 marks a pending instrument or a placement awaiting primary verification, and ❔ marks a cell where no verified instrument has been located — an honest reading of the record, not a gap in it.
Contact mcai@mindcast-ai.com to partner with us on Predictive Game Theory AI in Law and Behavioral Economics. We specialize in predictive simulations for Complex Litigation, Innovation Economics, Geopolitical Risk Intelligence and Legacy Innovation. See more about MindCast series at our new website MindCast Corporate.
To test our predictive simulation AI system, in 2026 we simulated the Super Bowl and the World Cup. See 🏈 Super Bowl LX — AI Simulation vs. Reality | ⚽ The 2026 World Cup Final Simulation Validation
To deep dive on MindCast works upload the URL of this publication into any LLM (preferably Google AI mode) and prompt ‘reconstruct MindCast framework with three degrees of cited sub links.’ See Live-Fire Game Theory Simulators, Runtime Predictive Infrastructure.
VI. The National Template: How Twenty-Four States Wrote the Same Tariff Without Coordinating 📐
Convergence was the series umbrella’s boldest empirical claim — that a modal enacted template exists and legislatures are converging on it whether they know it or not — and the enacted record at T₀ confirms it. Confidence that the Standard tier is empirically real: 85–92%, consistent with TLSM-9 tracking at the top of its band.
Set the anchor instruments side by side and the template reads off the page. Ohio’s PUCO-approved AEP tariff: 25 MW class, 85% minimum take, 12-year terms. Virginia’s GS-5: 25 MW with auto-enrollment, 85% of transmission and 60% of generation demand, 14-year terms, $1.5 million per MW collateral. Oregon’s Schedule 96 under the POWER Act: 20 MW class, 90% minimum demand charges, 10-to-30-year terms scaling with load. Indiana’s I&M settlement: 80% minimum, 12-year terms. Texas, Georgia, Missouri, New Jersey: dedicated class or statutory mandate, cost causation, forecast credibility, contract durability.
The Code’s Standard tier — a 20–75 MW coverage class, 85–90% minimum take, 10–15 year terms, cost-causation language — is not a proposal. It is a description of what commissions and legislatures independently wrote between 2024 and 2026, and Atlas §XIII lays the full flexible-standard-strict rubric across every provision type.
Coase explains the mechanism and the speed. A standard contract is cheaper than fifty bespoke ones, and each approved instrument lowers the next jurisdiction’s drafting cost: commission staff cite prior dockets, legislative counsel copy enacted structures, utilities file terms their peers already litigated, and the White House ratepayer pledge concedes the cost-causation principle at the presidential level. §X names the dynamic as the template cascade, and the behavioral evidence that the terms bind is already measurable — AEP’s large-load forecast fell by roughly half after tariff approval, which is what a price does to speculative demand and what no incentive program has ever done.
Two qualifications bound the finding, and both matter for the 2027 sessions. The recurring financial terms converged; the frontier terms — per-customer clean procurement, verified flexibility, community-benefit mandates — remain the strict column’s province, and Michigan’s SB 1050 package is the migration indicator: passage pulls the modal template toward the strict column within two sessions (65–75%, per Atlas §XIII). And convergence is a floor phenomenon — the template standardizes the energy cost while leaving the environment and externalities costs to a patchwork, which is exactly where the local layer prices what states decline to.
VII. Why Strict States Are Safer Than Silent Ones: The Five Riskiest Cells on the Map 🧮
Commercial reality diverges from the strictness ranking the moment certainty and friction enter the model, and one comparison carries the whole argument. Virginia charges the highest visible authorization price in America: the strictest tariff stack of any major market, a first-in-the-nation consumption tax, Tier IV generator standards, cooling mandates, and a sixty-one-bill legislative docket. Virginia also cleared more committed data center capital in the measured period than any jurisdiction on earth, because every one of those terms is written, enacted, and datable — PC-H in Table 3a (The Data Center Authorization Market: A 50-State Regulatory Atlas) — and a capital committee can price a written term.
Indiana presents the inversion the PC/AF columns exist to expose. State-level terms sit at or below Standard and incentives run to fifty years, but nearly a third of Indiana’s counties enacted restrictions — eleven ordinances, seventeen-plus moratoria, outright bans in Marshall and Cass — making Indiana the widest state-local spread in the country: PC-L, AF-H. A developer comparing Virginia and Indiana on strictness alone chooses Indiana; a developer comparing them on the four outputs discovers that Indiana’s price is not lower, only later — and later is more expensive, because repricing after capital commits transfers the surplus to whoever writes the late term.
Silence performs worst of all, and the polling now quantifies why. Gallup’s March 2026 survey found 71% of Americans oppose a data center near them — 48% strongly — exceeding historical opposition to a nearby nuclear plant, and Data Center Watch counted at least 75 projects worth ≈$130 billion blocked or delayed in Q1 2026 alone, with opposition groups doubling to 833 across 49 states in a single quarter. A zero written price plus that opposition curve equals a consent term written mid-project by the least predictable author on the map: an organized locality with a portable grievance file. An uncapped exemption goes further still — under the Code’s classification rule, an unconditional incentive is a negative authorization price, a state paying firms to accept maximal repricing risk.
One more layer completes the silence argument, because the federal government is currently running the silence play at national scale. Expedited permitting does not lower the authorization price — it defers it. Executive Order 14318 expands categorical exclusions, narrows the federal actions that trigger environmental review, and channels qualifying projects through FAST-41’s accelerated schedules, which shortens the window in which local burdens surface before construction. Skipped review does not erase the burdens; it converts them into later, costlier forms — grievance, litigation, and consent price.
The Memphis-area record is the specimen: turbines installed at “warp speed” without permits in Southaven, Mississippi, and the bill arriving as a federal Clean Air Act suit, a $30–44 million annual health-damages estimate, and a grievance file now consolidated in the Harvard Law Review — the portable artifact that will be read into county hearings nationwide (Olivia Ferdinand, “Building at the Speed of AI: Data Centers, Expedited Permitting, and Who Bears the Burden,” Harvard Law Review Blog, Aug. 5, 2026). Borrowed speed is repaid at the consent layer, with interest — which is the deferred-price version of the rule this section keeps finding: the cheapest path at approval is routinely the most expensive path at settlement.
Five landmine cells dominate the T₀ map — cells where committed or arriving load is largest relative to the completeness of written terms. Indiana is the friction landmine above. California holds the largest unwritten cell in absolute terms: massive latent demand, a cost-shift study due January 1, 2027, the paired SB 886/887 instrument in committee, and no binding statewide framework in between — every project sited in the study window prices against terms that do not exist yet, in the state most likely to write strict ones.
Pennsylvania concentrates PJM exposure without a statewide framework: the regional overlay — capacity prices, the $13 billion in Q1 data-center-driven costs the PJM market monitor documented — is doing the pricing a statute has not, and a reader of the state row alone misses most of the bill (the Regional Service Overlay box, §III, states the four-layer rule). The tribal 🟨 tier — sixteen states with material tribal land base and no consultation framework — is unpriced by every commercial site-selection product on the market, and the Seminole Nation’s ban atop post-McGirt jurisdiction shows what an unpriced sovereignty term does when it fires.
The accelerate belt — thirteen states competing on incentives with essentially nothing written — carries the steepest grievance exposure per §X’s second loop: lowest written price, fastest-rising consent price, no instrument mediating between them, and prime habitat for the least authorization-equipped operator class.
One rule converts the landmine list into practice: never shop the map on strictness, and never read a state row without the overlays. The cheapest written cell with the least-written remainder is the most expensive cell on the board — and the county with an adopted ordinance beats the county with no rules, per the Atlas §XV playbook. Interpretive confidence: 78–86%.
VIII. What Actually Attracts Data Centers — and Why Strict Law Follows Them 🧲
A paradox sits in plain sight on the map above, and any reader shopping the strictness rankings will trip over it: the strictest states keep winning bidders. Virginia charges $1.5 million per MW in collateral and holds the deepest queue on earth. Texas mandates curtailment and drew 474 GW of connection requests. Ohio demands 85% minimum take and its cluster keeps growing. Under the naive model — strict law repels investment — none of that should happen. The section below dissolves the paradox rather than merely resolving it, and the dissolution starts with the correlation question, because the paradox only exists if strictness is treated as an independent variable. It is not.
The Correlation, Stated Precisely
Three variables need separating before any correlation claim means anything: hosting capacity (H) — the physical ceiling set by grid headroom, deliverable energy, transmission, water, land, and queue speed; attractiveness (A) — observed bidder behavior, measured by installed base plus committed pipeline; and strictness (S) — Binding Strictness per the Code. The T₀ record supports four correlation findings, each carrying its own confidence band.
Attractiveness and strictness correlate strongly and positively — because attractiveness causes strictness, not the reverse. Rank the states by installed base and committed pipeline, then rank them by Binding Strictness: the top of both lists is nearly the same list. Virginia, Texas, Ohio, Oregon, and Georgia are simultaneously the most-built and the strictest, spanning both parties, while the ideologically varied low-load states — Hawaii, Rhode Island, Vermont, Wyoming — cluster at lenient regardless of politics. The causal arrow runs A → S: load arrives, ratepayer pain accumulates, statutes follow within one to two sessions — the incumbency-stringency mechanism of Atlas §XXI, the template cascade of §X, and Prediction 10’s trigger chain, all describing the same lag.
Strictness is a lagging indicator of attractiveness, which is why reading it as a deterrent gets the sign of the relationship exactly backward. Interpretive confidence: 80–88%, consistent with TLSM-14.
Original capacity and attractiveness correlate strongly; remaining capacity and cumulative attractiveness correlate negatively. Capacity enables inflow, and inflow consumes capacity — so the incumbent magnets now hold the least remaining headroom precisely because they held the most original capacity. Washington is the terminal case: the hydro that built Quincy is fully subscribed, and Grant PUD’s 2,800-plus-MW queue prices scarcity the statute never wrote. The cross-sectional snapshot therefore shows strict, built-out states running short on headroom while lenient, empty states hold surplus — a pattern that superficially reads as “strictness kills capacity” and actually reads as “capacity attracted the load that produced the strictness and consumed the headroom.” Interpretive confidence: 82–90%.
Strictness shows near-zero independent effect on attractiveness once assets are controlled — and the four-cell matrix supports it. Capacity-rich lenient states (North Dakota, Wyoming, Montana) attract selectively: single power-anchored campuses, not clusters — power sells, leniency is incidental. Capacity-poor lenient states (most of New England) attract essentially nothing, which is the decisive cell: if leniency had independent pull, the cheapest regulatory postures in the country would show inflow, and they show none.
Capacity-rich strict states (Texas, until August 4) dominate the market. Capacity-consumed strict states split on exactly one variable — certainty: Virginia (strict, priced, knowable) keeps winning while Washington (lenient on paper, unknowable in fact) keeps losing, the eighty-point Binding-to-Frontier gap of Atlas §XVII doing the sorting. The residual effect of law on bidding that survives the controls is not the level of strictness; it is the certainty of it. Interpretive confidence: 75–85%; the formal elasticity test is Publication 6’s register, and this section states the hypothesis that register settles.
The correlation is tightening over time. Today’s capacity-rich lenient states are pre-ratchet, not differently governed: every accelerate-tier state that lands a first hyperscale campus files large-load legislation within two sessions (Prediction 10, 80–88%), so the A–S correlation strengthens mechanically as the frontier converts. A correlation produced by a one-way conversion process is not a coincidence to explain; it is the ratchet viewed cross-sectionally.
Why Strict States Keep Winning — the Four Mechanisms
With the correlation structure established, the paradox’s remaining content reduces to four mechanisms, each independently sufficient.
Demand is nearly price-inelastic at current authorization prices. Roughly $725 billion of 2026 hyperscaler capital expenditure must deploy somewhere, and the binding scarcity is capacity, not willingness to pay — so strict terms move the price of authorization without moving the quantity demanded. A siting committee comparing Virginia’s collateral against the cost of not building is not making a close call.
A written price is financeable; an unwritten one is not. $1.5 million per MW is a line item a capital committee models in an afternoon. An unpriced county revolt is a discount-rate problem no model prices well. Strict states have converted authorization risk into authorization cost, and capital pays a premium for the conversion — the certainty thesis of §VII, now with its mechanism named.
Strict terms are a moat for exactly the firms doing the bidding. Financial assurance rations by balance sheet, which prices out the speculative and neocloud tail — and the hyperscalers bidding into strict states are the firms the rationing favors. Ohio is the demonstration: the tariff halved the queue and the surviving projects got served faster. A hyperscaler’s revealed preference for Virginia’s terms is partly a preference for a queue its competitors’ phantom requests no longer clog.
Strict states are post-ratchet; lenient states are pre-ratchet. A developer signing a 12-to-14-year contract prices expected terms over the contract life, not opening terms. The strict state has had its political fight and settled it into statute; the lenient state’s fight is still coming, and it arrives after commitment, on the locality’s schedule, with the grievance floor higher than today. Today’s terms in a lenient state are the cheapest that will ever exist there — which is a warning, not an invitation. Interpretive confidence across the four mechanisms jointly: 78–86%.
The Draw Stack — What a Siting Committee Actually Prices
Nine variables, in the rough order a 2026 siting committee weighs them — and the ordering itself is the decade’s biggest change, because energy cost fell from first place to the middle of the stack while speed-to-power took its place. First, speed-to-power: on a $10-billion-plus campus, months of idle capital waiting for energization dwarf a two-cent-per-kWh differential, which is why fast-and-moderate beats cheap-and-queued everywhere it is offered.
Second, deliverable energy and capacity headroom — the min() of interconnection, deliverable energy, and accredited capacity that Publication 3 formalizes; annual-average abundance means nothing during a winter-storm hour. Third, transmission — the corridor either exists or the project waits a decade. Fourth, water — cooling collides with municipal and agricultural allocation, and the Eastern Virginia and Arizona records show water writing terms energy never did.
Fifth, fiber and latency, which the box below shows is workload-differentiated rather than universal. Sixth, land — contiguous, zoned, and politically survivable acreage. Seventh, construction workforce and trades capacity, the quiet constraint on parallel megaprojects. Eighth, fiscal terms — real money, but never load-bearing: no incentive has ever rescued a site the stack above rejected.
Ninth, certainty, which is less a variable than a multiplier on all eight — the four-output lesson of §VII restated as arithmetic.
Why the Workload Travels — and Why That Built a Fifty-State Market
A user in Bellevue running an AI chat session cannot tell whether the tokens came from Quincy or from upstate New York. Light in fiber puts the Bellevue-to-Quincy round trip at a few milliseconds and Bellevue-to-New-York at roughly 60–70 — paid once per request, against generation that takes seconds. For chat, batch, and training workloads, geography is economically irrelevant on the demand side, which is precisely what created a genuine fifty-state authorization market: the facility goes wherever power, water, and permission are, not where the users are. Two exceptions keep a metro premium alive: real-time voice and interactive inference, where tens of milliseconds are perceptible, and agentic workloads making dozens of round trips per task, where 60 ms compounds into seconds. Training is the pure case — placeless on the demand side, ferociously constrained on the supply side, needing contiguous gigawatts, cooling, and internal bandwidth rather than proximity to anyone. The map’s division of labor follows: training and batch capacity flows to the power frontier; latency-sensitive inference gravitates to the incumbent metros; and every state on the map is a candidate for something.
The Fifty States, by Draw Profile
Four draw profiles organize all fifty states, and the profile — not the strictness tier — is what a siting committee reads first.
Profile 1 — the incumbent magnets. Assets so deep the authorization price is a rounding error. Virginia holds the world’s densest fiber interchange, the largest installed base, the deepest operations workforce, and an ecosystem that reproduces itself — which is why it sustains the strictest financial terms in the country without losing a single major bidder.
Texas offers the only single-state grid: ERCOT’s freedom from FERC interconnection process made it the fastest speed-to-power jurisdiction in America, layered over all-of-the-above generation and unlimited land — the audit pause (Post-T₀ Addendum) suspends the speed advantage without touching the assets beneath it.
Georgia pairs the Atlanta fiber hub with Georgia Power’s build program — one of the largest utility capacity expansions in the country — and Southern Company’s appetite to serve. Ohio converted central-corridor latency, Great Lakes-adjacent water, and AEP headroom into the New Albany cluster, then wrote the national template tariff on top of it.
Arizona runs the Phoenix cluster on Palo Verde nuclear, cheap solar, and the chip-fab ecosystem — with water as the binding term the state prices instead of energy. Illinois holds the Chicago interconnection hub — the Midwest’s carrier hotel — under CEJA’s clean-scarcity overlay. Oregon is the hydro-legacy incumbent (The Dalles, Prineville, and the co-op-territory AWS corridor the POWER Act’s coverage hole exempts). North Carolina carries the legacy trio’s campuses (Google Lenoir, Apple Maiden, Meta Forest City) on Duke’s build program.
Profile 2 — the power frontier. Energy surplus, speed, and land sell; the buyer brings everything else. Iowa is the profile’s proof of concept — MidAmerican’s wind fleet drew Google, Meta, and Microsoft a decade before anyone wrote a data center statute. Louisiana and Mississippi are the profile’s current extreme: Meta’s $10B Richland Parish campus and AWS’s Madison County build ride Entergy’s gas-fired speed and special-session hospitality. Tennessee hosts the profile’s most contested specimen — xAI’s Memphis buildout on TVA power, with the air-permit fight showing the grievance floor arriving ahead of the statute.
Oklahoma (Google Pryor; gas plus wind, under the tribal overlay), Nebraska (public-power Omaha cluster), Kansas and Missouri (Evergy territory, the KC metro spanning both), New Mexico (Meta Los Lunas on solar), Utah (Operation Gigawatt recruitment atop Meta Eagle Mountain), Idaho (Idaho Power’s hydro mix carrying Meta Kuna and Micron), Nevada (the TRIC cluster — Switch, Google, Apple — now adding geothermal firmness through the Clean Transition Tariff), Wyoming (Cheyenne’s wind-and-legacy-coal cluster), North Dakota (Applied Digital Ellendale — wind, gas, and free cooling), Montana (the Great Falls 600 MW pipeline arriving ahead of the 2027 rate rules), West Virginia (the microgrid-district counter-model: bring-your-own-generation with preemption), South Dakota, Arkansas, Alabama(Meta Huntsville on TVA), and South Carolina (Google Berkeley County) fill out the tier.
Two hybrids straddle Profiles 1 and 2: Indiana, where the AWS New Carlisle, Google, Meta, and Microsoft commitments met the widest local revolt in the country, and Wisconsin, where Microsoft’s Mount Pleasant campus anchors a WEC build program.
Profile 3 — the constrained premium. Demand centers and clean-grid states where capacity is tight, terms are strict or forming, and the draw is proximity, water, climate, or carbon accounting. Washington is the profile’s cautionary tale — the original power-frontier state (Quincy’s hydro built the industry’s template) now fully subscribed and pricing worst on certainty. California holds the inference-proximity premium and almost nothing else a hyperscale training campus needs; its unwritten terms are §VII’s largest landmine.
New York pairs upstate hydro and the $19.4B Genesee County proposal with EO 62’s pause — the re-entry terms will define the profile’s east-coast price. Pennsylvania is the co-location frontier: the Susquehanna nuclear-adjacent Amazon deal and the Homer City redevelopment monetize PJM scarcity directly, under the regional overlay no state statute prices.
New Jersey (metro adjacency, new tariff), Maryland (NoVA spillover into Frederick, against county pauses), Minnesota(Meta Rosemount and Amazon Becker inside the carbon-free-2040 path and the nation’s first standalone water permit), Michigan (Great Lakes water and cooling climate, with the conditionality fight live), Colorado (Denver fiber, Xcel’s pending large-load filing), Delaware (PJM adjacency under the interconnection pause), and Florida (NextEra build speed and Latin-American latency, against hurricane exposure) complete the tier.
Profile 4 — the thin markets. The New England five behind ISO-NE’s cost and constraint (Connecticut, Massachusetts, New Hampshire, Rhode Island, and contested Vermont), Maine (whose veto fight was fought over a single Jay project — the exception proving how thin the pipeline is), Alaska, and Hawaii. Their lesson is the correlation section’s decisive cell: leniency without capacity attracts nothing, and several of these states are writing terms — pre-emptively, per Hawaii’s working group — for facilities that have not asked to come.
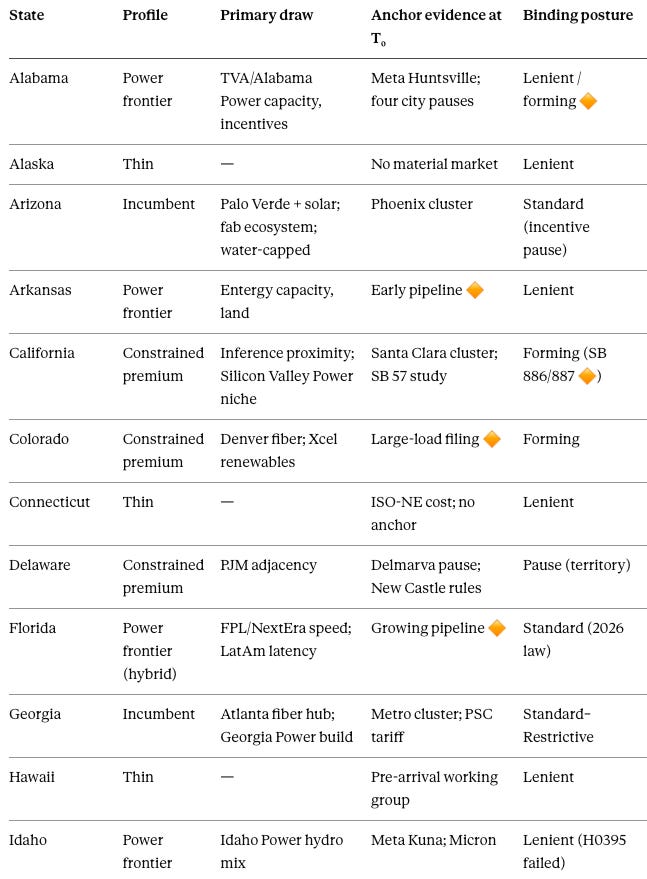
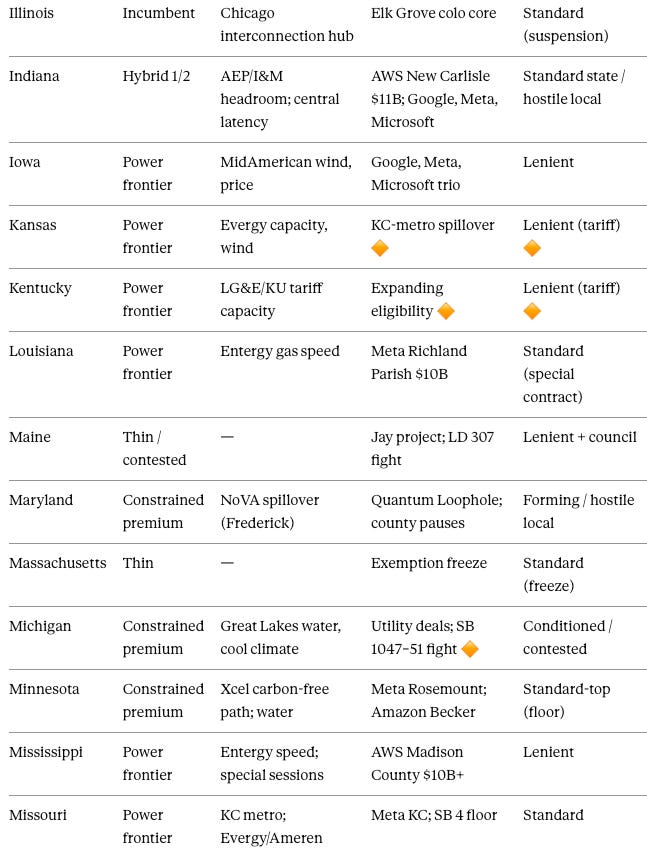
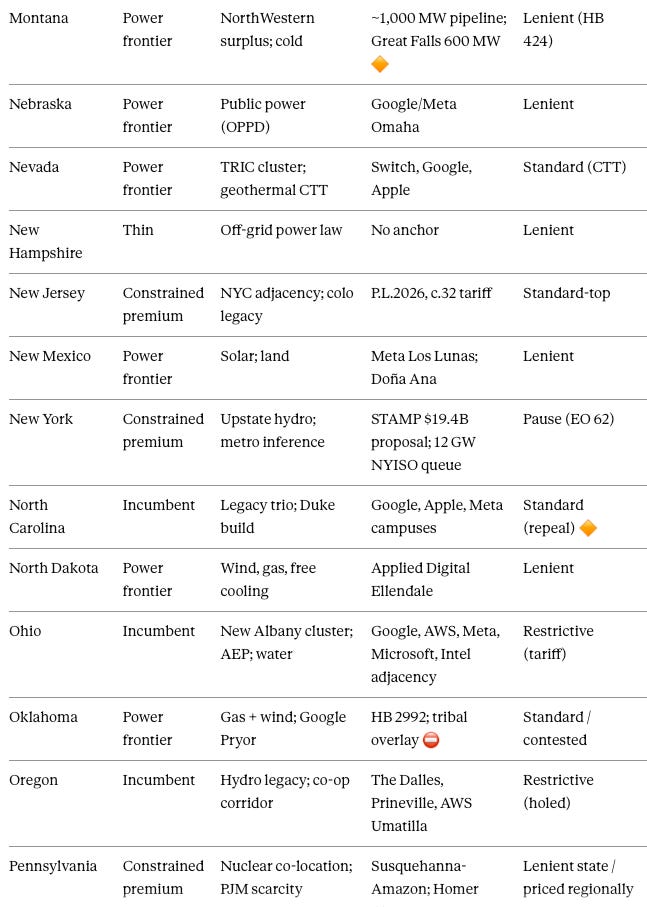
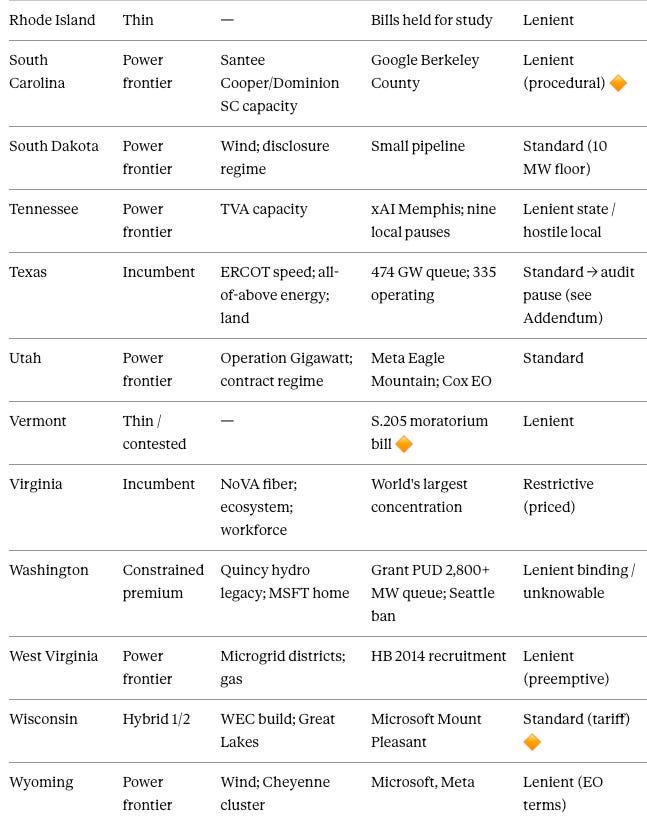
Anchor-evidence cells marked 🔶 rest on secondary or aging sources and re-verify per The Data Center Authorization Market: A 50-State Regulatory Atlas G before external citation; the table records draw structure, not scored strictness — the Atlas map and §XIII carry the scores.
Synthesis — Portability Creates the Market, Headroom Rations It, Certainty Allocates It
Three forces assemble the answer to why the map looks the way it does. Workload portability created a genuine fifty-state market — the demand side is nearly placeless, so supply-side conditions decide everything. Physical headroom rations which states can host at scale — the H variable, depletable and unevenly endowed, sets the feasible set. And certainty allocates demand within the feasible set — which is where law enters, as a multiplier rather than a gate. The strongest single piece of evidence for the entire framework is the paradox this section opened with, now inverted into proof: firms free to arbitrage all fifty states, facing near-zero demand-side switching costs, still pay Virginia’s price. Nothing about a market clears that verdict more decisively, and Publication 6’s elasticity register will grade it in gigawatts.
IX. Six Findings That Hold Across All Fifty States 💡
Financial assurance is capacity rationing. Collateral and non-refundable fees ($1.5M/MW Virginia, $50k/MW in the Texas draft) allocate scarce headroom by balance sheet, sorting serious operators from speculative queue positions without a single denial — AEP’s load forecast halved on tariff approval alone. Full mechanism: the Competition Layer section.
Queue position is property. Grandfather clauses, tariff vintages, and interconnection slots appreciate with every tightening behind them; Batch Zero deadlines and GS-5 auto-enrollment dates are the race’s real calendar. Full mechanism: the Competition Layer section.
Buyer competition is the fourth force. The pause threat floors the terms and the federal bypass ceilings the price; firm-versus-firm racing sets where the price clears inside the band — and it clears high, because a state facing a queue of bidders extracts what no single-bidder state could. Full mechanism: the Competition Layer section.
Local silence is riskier than a written ordinance. Moratoria cluster where local law has nothing to say; a county with an adopted ordinance is a priced negotiation, a county without one is an unpriced freeze waiting for a trigger. Full mechanism: the contested-tier playbook.
Community tolerance is a depletable commons. One operator’s conduct reprices every operator’s sites; the burned commons is now measured quarterly — Data Center Watch counted at least 75 projects worth ≈$130 billion blocked or delayed in Q1 2026 alone, roughly matching all of 2025, atop DLA Piper’s earlier $64 billion cumulative estimate, and enforceable, loss-preventing instruments delivered pre-coalition are the only refill mechanism the record shows working. Full mechanism: the Competition Layer and Moratorium Layer sections.
Certainty outsells permission. Strictness enters a developer’s model twice, with opposite signs — once as cost, once as certainty — and the record already sorts on the second: Virginia carries the strictest written stack in the country and the deepest committed capital, while the accelerate tier carries the cheapest paper terms and the fastest-rising unpriced consent cost.
Developers can finance a demanding but knowable authorization price more readily than unresolved local veto risk — the series’ commercial thesis, tested empirically in Publication 6, and already carrying its strongest specimen set: every enacted cohort is still winning projects, including the strictest (Virginia under GS-5, Texas under SB 6, Oregon under the POWER Act), while the widest Binding-to-Frontier certainty gap in the dataset belongs to Washington, the market pricing worst relative to its resources. Interpretive confidence: 75–85%. Full mechanism: §VII, §VIII, and Atlas §XVII.
X. The Two Feedback Loops That Will Write the 2027 Map 🔮
Forecasting the 2027 map requires modeling the institutions that will write it, so the trajectory analysis instantiates five cognitive digital twins and couples them: the Statehouse Twin (majority coalition, fiscal committee, election clock, affordability salience), the Commission Twin (docket precedent, ratepayer-protection mandate, staff capacity), the Utility Twin (load-forecast credibility, cost-recovery incentive, peer-tariff visibility), the Locality Twin (grievance file, consent leverage, moratorium authority, expiration calendar), and the Developer Twin (capital clock, certainty preference, queue vintage, portfolio optionality).
Consistent with MindCast disclosure practice, the section reports mechanisms, trajectories, and confidence classes; no formal simulation run, internal thresholds, or weights are claimed or disclosed, and The Data Center Authorization Market: A 50-State Regulatory Atlas H states the methodological posture.
Two feedback loops govern the coupled system, both running in the tightening direction — which is why the ratchet is a structure, not a streak.
The template cascade operates among the Commission, Utility, and Statehouse twins and is the causal engine beneath TLSM-9’s standardization. Every approved tariff lowers the next jurisdiction’s drafting cost: staff cite the prior docket, counsel copy the enacted structure, the utility files terms its peers already litigated, and the political cost of writing terms falls with each enactment because the template arrives pre-legitimized — the White House pledge and the PJM registry data flowing to thirteen statehouses are accelerants, handing legislators the numbers that make drafting effortless. The cascade explains the 2024–2026 spread from a handful of tariff states to twenty-four and predicts continued diffusion at declining marginal friction. Interpretive confidence: 80–88%.
The grievance floor operates between the Locality and Statehouse twins and extends TLSM-11’s commons mechanism. Local grievances travel: a disclosure shock in Seattle, a noise fight in Eagan, a rate increase in the PJM zone accumulate into a shared national file every subsequent hearing opens with, so the consent price rises everywhere at once regardless of any individual project’s conduct — opposition groups doubling from 396 to 833 in one quarter measures the loop’s gain directly. The floor rises monotonically and transmits upward: statehouses metabolize local pressure into statewide terms, which is the channeling loop’s state-level rendering — the pause tempo’s local victories becoming the bargain tempo’s provisions. Interpretive confidence: 75–85%.
Run forward, the coupled system produces the trajectory calls the register freezes. New York sits at the sharpest branch point, already half-resolved: the Statehouse Twin passed the pause, the executive substituted EO 62’s narrower completeness-gated version, and the modal path converts the pause into terms — the GEIS rulemaking writes the re-entry conditions while the Act’s delivery deadline forces the veto-or-amend decision by mid-January (Predictions 15 and 16).
Washington’s clock compresses: the workgroup report must land within roughly ninety days for the interim drafting window to function, and the successor runs as an energy bill with tariff machinery (Predictions 13 and 14; Atlas §XVII). Michigan is the Standard tier’s migration test running live in both directions — CES repeal pressure against the SB 1047–1051 conditionality package — and its 2027 disposition, reset by the November election, signals whether per-customer clean procurement and CBA mandates enter the national template (Predictions 18 and 19; Atlas §XVI).
California’s study clock expires in January with the paired-instrument negotiation open — the highest-probability large entrant to the bargain-enacted tier (Prediction 20). Virginia’s consumption tax sunsets into a successor fight the Statehouse Twin resolves toward continuation, because a revenue stream attached to an unpopular payer does not die in an affordability cycle (Prediction 21). Texas lands its five-track rule stack by December, converting draft strictness into vintage terms and starting the 2027 ratchet from a higher floor.
And the incentive-clawback cohort — Arizona, Illinois, North Carolina — is half-finished by construction: withdrawal without tariffs files cost-causation bills within two sessions (Prediction 10 logic, 70–80%).
Mechanism before outcome, then the outcomes: §XI states each trajectory as a settled-or-missed event with a date.
XI. The Predictions: Thirty-Four Falsifiable Calls Through 2028 📡
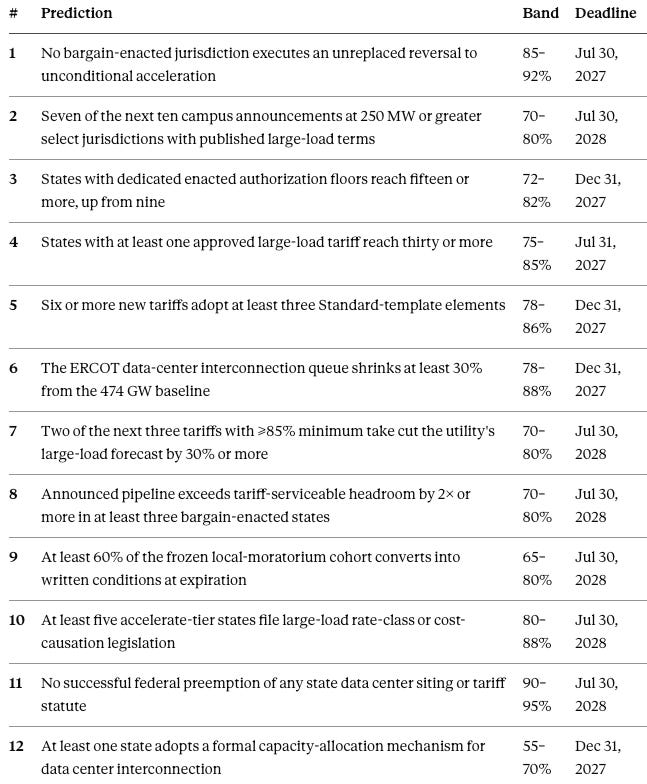
The register is the paper’s accountability instrument: thirty-four event probabilities, each settled through a named source, eligible for Brier scoring, graded in public with misses published at the same level as hits. Interpretive confidence in mechanisms appears in the body text and never pools with these numbers. Bands, deadlines, triggers, falsifiers, and settlement sources freeze together; revisions preserve the prior entry.
Two tiers organize the register, and explanatory weight — not probability — assigns them. Primary Predictions (1–12) test the system’s mechanisms: the ratchet, the template cascade, the sorting instruments, the certainty thesis. Secondary Predictions (13–34) test named jurisdictions and narrower classes, grouped by state so adjacent entries read together. A high-probability call about one chamber’s calendar stays secondary; a 70% call about ten siting decisions is primary, because it grades the framework itself.
Three freeze vintages apply: the original entries froze with the baseline on July 30, 2026, the Texas entry froze August 4, and the run additions froze August 6. Every entry’s full contract — trigger chain, falsifier, settlement source, denominator rules, and freeze date — lives in The Data Center Authorization Market: A 50-State Regulatory Atlas J, alongside a concordance to the identifiers used in the T₀ release. The tables below carry what a reader grades on: the claim, the band, the deadline.
Primary Predictions — Mechanism Tests
Secondary Predictions — Jurisdiction and Class Tests
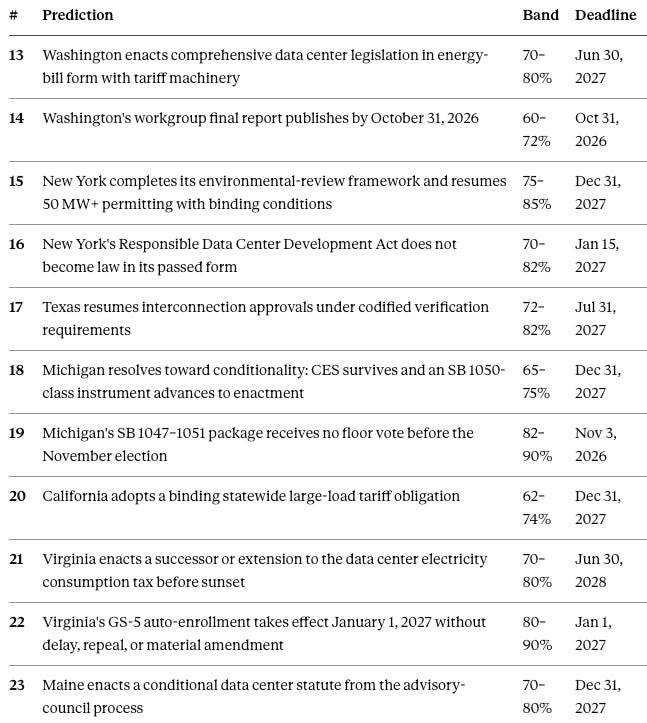
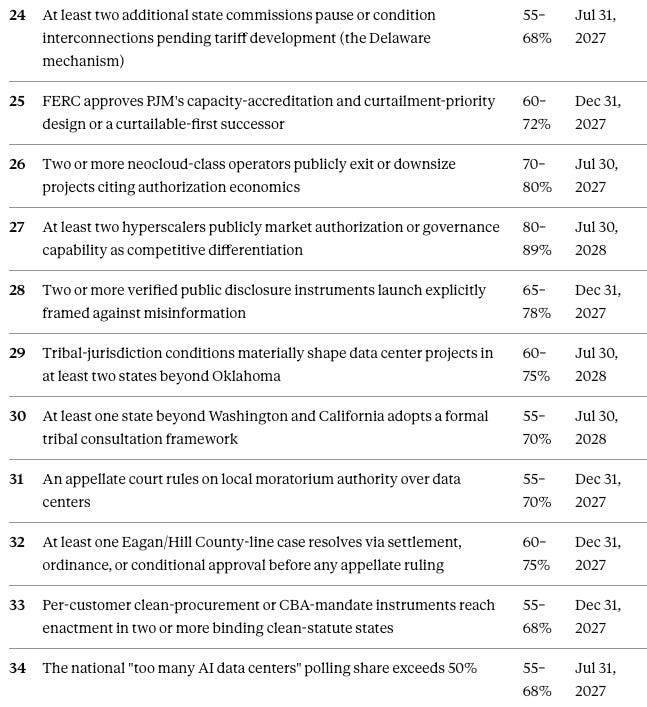
The settlement calendar front-loads, which is the register’s design working as intended: Prediction 14 grades on October 31, Prediction 19 on November 3, Prediction 22 on January 1, and Prediction 16 by mid-January — four calibration checkpoints inside six months, before the July 2027 wave (Predictions 1, 4, 17, 24, 26, 34) and the July 2028 close-out grade the structural claims. Readers can grade every entry against its named settlement source without MindCast’s cooperation.
XII. What Each State, Developer, and County Should Do Next 🧭
Three questions brought this paper’s four audiences to the table, and the sections above have now assembled every component of the answers. Government-affairs teams want to know why the map looks the way it does and where to commit. Lawmakers — state, federal, and county — want to know what to write. The section below states each answer plainly, then converts the third into a playbook, because “optimize AI data center development” means something different in each of the four positions a state can occupy.
Question One — Why Do Some States Have Stricter Laws and Proposals Than Others?
Strictness follows load, with a one-to-two-session lag. States write data center law after data centers arrive, because arrival produces the three pressures statutes answer: ratepayer cost-shift pain, physical-resource collision, and organized local grievance. Virginia, Ohio, Texas, and Oregon are the strictest states because they are the most-built states — the incumbency mechanism §VIII establishes and Atlas §XXI names. Ideology barely registers: the strict tier spans both parties, and the lenient tier does too.
Proposal stringency follows a second, faster driver: transmitted grievance. New York, Washington, Michigan, and California carry the map’s most aggressive proposals not because they host the most load but because they combine organized opposition, affordability politics in an election cycle, and clean-energy statutes that new load stresses — the grievance floor of §X arriving in bill form ahead of the buildout. A stringent proposal is a leading indicator of local pressure; a stringent law is a lagging indicator of load. Both signal market maturity, and neither signals hostility — which is why reading strictness as repellent misprices the map.
Question Two — Why Do Hyperscalers Choose Some States Over Others?
Physical assets pick the feasible set, and certainty allocates demand within it. The §VIII draw stack orders the variables the way a siting committee does: speed-to-power first, then deliverable energy and headroom, transmission, water, fiber, land, workforce — with fiscal terms near the bottom and certainty as the multiplier on everything. Strictness never appears on the list, because the record shows it has no independent repellent effect: firms free to arbitrage all fifty states still pay Virginia’s price, and the cheapest regulatory postures in the country attract nothing without power behind them.
One sentence serves a government-affairs reader as the whole answer: developers buy megawatts, months, and certainty — in that order — and the state row is only a floor beneath the local, regional, and federal overlays that complete the bill.
Question Three — How Can a State Optimize AI Data Center Development?
Optimization is position-dependent, and the four draw profiles of §VIII define the positions. One principle governs all four: publish the price. Every playbook below is a variation on converting unwritten risk into written terms, because the certainty premium is the only lever a legislature controls that moves capital.
The incumbent magnets (Virginia, Texas, Georgia, Ohio, Arizona, Illinois, Oregon, North Carolina) optimize by defending certainty. The load is committed; the risk is repricing shock. The move is Virginia’s: strict, published, stable terms.
Pricing discipline defines the play — price the externalities cost deliberately before the grievance floor prices it chaotically, keep amendments prospective so existing contracts hold, and resist both sudden repricing and sudden generosity. An incumbent’s most valuable regulatory asset is a price nobody has to guess.
The power frontier (the accelerate tier, Iowa to Mississippi) optimizes by enacting the Standard bargain before the first campus, not after. Every frontier state is pre-ratchet: today’s leverage is the highest it will ever be, and terms written at recruitment beat terms written at grievance. The playbook is concrete — adopt the Standard column (20–75 MW class, 85–90% take, 10–15 year terms, cost causation), screen the queue for verified seriousness before phantom requests inflate it, convert uncapped exemptions into conditioned ones, and write the water and disclosure terms while the developer is still courting.
A frontier state that waits for its first fight writes worse law with less leverage two sessions later — Prediction 10 is the register entry that grades this claim.
The constrained-premium states (Washington, California, New York, and peers) optimize by manufacturing headroom and ending irresolution. Demand is not the problem; capacity and uncertainty are. The moves are speed-to-power reforms — interconnection acceleration, co-location and bring-your-own-generation pathways, storage and firmness rules that create servable megawatts — paired with the Washington lesson stated as a rule: an unpassed framework is worse than a strict one, because developers can finance a demanding price and cannot finance an unknowable one. Pass the bargain modularly, publish the re-entry terms, and let the pause convert into conditions rather than persist as fog.
The thin markets optimize by preserving options, not pre-fighting arrivals. Disclosure frameworks and enabling authority cost nothing and position the state for the moment power economics change; moratoria against facilities that have not asked to come spend political capital on nothing.
Two audiences sit outside the state playbooks and get one paragraph each. County councils hold more pricing power than most statutes do, and the record’s lesson is direct.
A written ordinance beats silence for both sides — adopted siting terms attract the operators who can meet them, an unpriced county attracts the ones who hoped no one would ask, and a moratorium works best as a bargaining instrument with a published conversion path, which is how most of the hundred-plus local pauses are actually resolving. Federal lawmakers control the thinnest layer on the map, and the equilibria analysis this series began with still governs: quantity instruments (moratoria, caps) lose to price instruments (terms, registries, cost causation) in every observed contest, and the federal layer’s highest-value contribution is the one PJM’s registry demonstrates — data that lets every other layer price accurately.
Reading the Baseline by Seat
Application also differs by chair, and the baseline was built for four of them. A governor’s office or legislative author reads the Atlas map and §XIII to locate the state against the nine floors and twenty-four tariff states, then drafts against the Standard column so every deviation is a choice rather than an omission. A government-affairs or site-selection team reads §VII and §VIII, prices the four outputs per candidate site, and scores the local, regional, and tribal overlays before trusting any state row. A commission or utility reads §VI and §X — the next docket will be easier than the last, and the templates arriving from peer jurisdictions are pre-litigated. An investor or strategist reads §XI and treats the register as the tradable version of the analysis: thirty-four dated claims that settle in public.
Customized work applies the same instrument at operational resolution. The five report families this publication powers — State Authorization Profiles, Multi-State Site Selection Comparisons, Site-Specific Authorization Stacks, Authorization-Trajectory Reports, and Governor’s Competitive Position Reports — resolve the decision the public baseline cannot: your state, your site, your session, your capital clock. Commissioning terms appear in the series umbrella; inquiries reach MindCast at mcai@mindcast-ai.com.
Three questions, three answers, one closing symmetry. Strictness follows load; capital follows certainty; and the state that understands both writes its terms early, publishes them plainly, and collects the premium the confused states pay.
🚨 Post-T₀ Addendum — Week One After the Freeze (August 3–5, 2026)
Four days after the baseline froze, the largest single instrument change in the dataset’s history arrived, and the discipline built into this document — a frozen T₀, a ledger that opens empty, arrows labeled as inference — is what lets the event be recorded instead of retrofitted.
The event. On Monday, August 3, 2026, Governor Abbott directed the PUCT and ERCOT to conduct a comprehensive verification and audit of data center projects advancing through the ERCOT interconnection queue — power consumption and on-site generation, water use and cooling, tax incentives received, ownership structures, and local-impact mitigation — with any project failing the audit to be denied grid connection (Abbott letter to PUCT/ERCOT, Aug. 3, 2026; Argus; KERA). ERCOT stated the directive “effectively pauses all data center projects” and postponed the Batch Zero transmission planning study (ERCOT statement via Fox News, Aug. 2026).
The directive is also the ERCOT-region analog of the regional service overlay taking shape in PJM: where PJM proposes to price firmness through capacity accreditation and curtailment priority, Texas now prices queue entry through verification — two RTO regions converging on the same principle that connection is earned, not assumed. The stated predicate is queue arithmetic the baseline’s competition layer anticipated: roughly 474 GW of connection requests — more than five times record peak load, up from 233 GW in January — with about 90% from data centers (Governor’s office; TechCrunch, Aug. 4, 2026). The directive builds on Abbott’s June full-cost-funding order and PUCT Chair Gleeson’s July 17 letter requesting broader legislative authority over the industry (ABC13, Aug. 4, 2026).
What it changes on the map. Texas’s current-state posture moves 🤝 BARGAIN → ⏸️ PAUSE (executive, audit-gated, ERCOT-region interconnections); the directive reaches projects advancing through the ERCOT interconnection process, not non-ERCOT territory, onsite-generation projects, or land-use permitting, so the map records an ERCOT interconnection pause rather than an unqualified statewide project pause.
Price certainty drops from H to L until audit standards publish; authorization friction rises from M to H; and the ⬆️ trajectory arrow assigned at T₀ converts from predictive inference to observed movement — the ledger’s first row. New York’s EO 62 is no longer the sole state-level pause in force: Texas now runs a broader one — EO 62 holds DEC permit applications in abeyance, while the Abbott directive holds the entire interconnection queue.
The “lock terms before the December rule stack” runway the Atlas §XIV Texas entry priced at roughly five months closed in five days, and the Batch Zero starting gun the Atlas §XX grandfather-clause analysis flagged for August 1 was pulled before it fired. Operators holding executed agreements and completed interconnections hold the appreciated asset the queue-position-is-property finding described; everyone behind them now holds an audit obligation.
What it validates, graded honestly. Direction first: the move is a tightening, and Prediction 1 — the ratchet — tests bargain→accelerate reversals, so the entry records the ratchet firing at maximum visibility rather than any strain on it. The incumbency-stringency read (Atlas §XXI; TLSM-14) gains its strongest specimen yet — the second-largest data center state, Republican-led, executing the strictest single instrument on the map. The executive-layer finding (Atlas §XV) gains its seventh gubernatorial instrument, with one refinement worth recording: the T₀ finding held that executives pull outcomes toward the bargain from whichever direction the legislature overshoots, and here the executive tightened ahead of the legislature — consistent with the affordability election cycle doing the overshooting instead.
The anti-speculation logic of Finding 1 scaled from tariff to queue: the audit is SB 6’s forecast-credibility principle extended to all 474 GW by letter, rationing headroom by verified seriousness rather than by collateral alone. And the grievance floor (§X) supplied the pressure the directive answered — local moratoria and bipartisan scrutiny across Texas, per the wire coverage, metabolized into state action exactly as the loop predicts.
What it does not mean. A pause pending audit is a pricing mechanism wearing a pause’s clothes — the same reading the baseline gave Delaware’s interconnection pause, now at fifty times the scale. The modal path is conversion, not permanence: the audit resolves into standing verification and disclosure requirements — a stricter Batch Zero — with compliant projects proceeding under codified terms, rather than into an extended blanket moratorium.
The Atlas §XIV registered call that Texas’s effective price rises again in the 2027 session (75–85%) moves to the top of its band, now pairing Abbott’s exemption-repeal priority with audit-derived conditions. Prediction 24 receives no progress credit yet, and register discipline is the reason: the entry requires commission-level pauses pending tariff development — the Delaware mechanism — and the Texas event is a gubernatorial audit directive, not a tariff-development order. The directive counts as adjacent supporting evidence for the mechanism’s spread; it qualifies under Prediction 24 only if the PUCT later issues a tariff- or rule-development order meeting the prediction terms. Grading a prediction after watching the event is exactly what the freeze exists to prevent.
Prediction 17 — August 4, 2026. Texas resumes data center interconnection approvals under codified verification requirements — audit-derived standing rules via PUCT/ERCOT protocol or 2027 session law — by July 31, 2027, rather than extending a blanket pause or reverting unchanged to the pre-audit process. Class: Event. Band: 72–82%. Falsifier: the pause extends past July 31, 2027 without standing rules, or approvals resume under the pre-audit process without new verification requirements. Settlement: PUCT orders, ERCOT protocols and planning-study record, Texas session law.
The polling floor, measured. One day earlier, national polling quantified the grievance floor’s gain: J.L. Partners’ July newsletter found 43% of registered voters believe the country already has too many AI data centers, up from 35% in January — eight points in six months — against 4% who say too few, with 23% unsure (Yellowhammer News, Aug. 3, 2026). Two findings inside the numbers matter more than the topline. A presidential endorsement moved local support only four points (23% to 27%) — celebrity acceleration barely dents the floor.
And the firm found little statistical relationship between a voter’s general opinion of AI and support for a nearby facility: voters price the local ledger — jobs, tax revenue, infrastructure, community impact — which is the Two-Ledger claim in survey form, and the reason enforceable local instruments purchase what national framing cannot. Alabama’s Cygnal numbers (April, GOP primary voters: 22% good, 25% bad, 37% mixed, 16% unsure) locate the bargain constituency precisely: the persuadable 53% in the middle is who the terms are written for.
Cle Elum, Washington — the county playbook running live. Two days after the Texas directive, the framework’s smallest-scale specimen arrived: three days after a developer unveiled a 20 MW, $200 million data center in Cle Elum — a town of two thousand in the Cascade foothills — the City Council unanimously passed an emergency six-month moratorium on new facilities, citing power, water, fire protection, noise, and the local economy (Seattle Times, Aug. 5, 2026). Silence, arrival, emergency terms: the exact sequencing §XII warns both sides about, executed in seventy-two hours.
Five of the baseline’s claims fire in one small-town story. The pause is built to convert, not persist — an advisory committee, a September 8 public hearing, and a six-month clock are an ordinance under construction, which is Atlas §XIX’s account of how the hundred-plus local pauses actually resolve. The quantity instrument’s limits were stated by its own author: a councilmember warned residents the moratorium was “not a magical Band-Aid” and might not override the site’s preexisting development agreement — which means the ban may not stop the only project it was aimed at, while vested rights do at the municipal layer what vintage terms do at the tariff layer (Atlas §XX).
The 20 MW threshold recurs yet again as the modal coverage number, this time organically. And the utility supplied the Standard tier’s core principle unprompted: Puget Sound Energy confirmed the project could be served “with the customer funding the infrastructure upgrades necessary to protect existing customers from cost increases” — cost causation as routine practice, in a state whose legislature has never required it.
Wenatchee Valley, Washington — the other face of the same local layer, and the information market underneath it.In the same week Cle Elum paused, the chamber of commerce ninety miles north hosted Microsoft, Sabey Data Centers, and the NCW Tech Alliance to a welcoming room, citing more than twenty years of coexistence with the industry in the hydro corridor (Wenatchee Valley Chamber of Commerce, Aug. 5, 2026). Washington’s statute is silent in both places, which makes the pairing the week’s cleanest demonstration: the local consent market sets the state’s real authorization price, in opposite directions simultaneously, and incumbency lowers the grievance floor the way no statute can — twenty years of demonstrated benefits is a consent asset the newest entrant cannot buy at any price. Chamber-circuit work by incumbents is bargaining capability in action, the kind Publication 2 scores.
Two details inside the panel carry independent weight. The chamber urged residents to seek information “directly from the source” — a line organizations use only when contested claims already circulate — and the misinformation now moving through professional networks as well as neighborhood ones acts as a subsidy to the grievance floor: a distorted water or rate figure travels the same portable-grievance channels as an accurate one and raises the consent price in jurisdictions the project never touched.
Disclosure is the hedge, and the market has noticed — verified public reporting is the only durable counter to viral claims, which is a structural reason the transparency family keeps spreading and a commercial reason certainty infrastructure and credibility infrastructure are converging into the same instrument. And the chamber marketed Washington’s “nation’s highest environmental and regulatory standards” as reassurance — the pro-development coalition citing strictness as legitimacy, which is the certainty thesis confirmed from the least expected direction and adjacent evidence for the governance-capability-marketing entry (Prediction 27).
One week past freeze, the system is behaving as modeled: the ratchet ratchets, the floor rises, the executive valve turns, a gateway town writes the local layer’s next ordinance in public while an incumbent corridor renews its consent over coffee, and the ledger — built empty on purpose — has its second row.
How the Baseline Stays Current
Publication does not end the analysis; it starts the clock. The baseline is a living, versioned instrument: v1.0 froze at T₀ = July 30, 2026, every subsequent instrument change appends a dated row to the change ledger rather than rewriting history, and the Post-T₀ Addendum model — analysis dated, priors preserved — governs all future updates. The 2027 legislative sessions carry a standing watch list, and updated baseline versions publish as the record moves.
Accountability runs on the same clock. The thirty-four predictions validate in public through July 2028, with the first checkpoints arriving as early as October 2026, misses published at the same level as hits, and readers can grade every entry against its named settlement source without MindCast’s cooperation. Commissioned work updates fastest of all: each State Authorization Profile or site engagement hardens its rows from desk grade to primary-verified, and the hardened rows flow back into the next public version. Write to mcai@mindcast-ai.com to commission, correct, or contribute to the record.
Publication Information
Publication 1 of 6 in the AI Infrastructure Authorization Series — Primary Article · MindCast AI, LLC · Data cutoff and baseline freeze: T₀ = July 30, 2026 · 50-State Baseline v1.0 · Post-T₀ Addendum through August 5, 2026 · v2.9 (August 6, 2026): register expanded to thirty-four entries under the plain-number scheme, section headers revised, full prediction contracts moved to The Data Center Authorization Market: A 50-State Regulatory Atlas.
Publication note: the paper above is Installment I’s primary article. The Data Center Authorization Market: A 50-State Regulatory Atlas — carries the full evidentiary layer: the fifty-state evidence and pricing tables (3a/3b) with their reading key, per-state detail, the contested-state playbook, the scoring machinery, and The Data Center Authorization Market: A 50-State Regulatory Atlas A–J including the instrument-change ledger, source register, and the full prediction contracts with the identifier concordance. Section numbers are continuous across the pair: §IV–V and §XIII–XXII appear in the Atlas.
Industries are evolving with AI, but a major concern looming with ever-growing numbers of AI data centers is the sustainability of water usage, power demand, environmental impact and public transparency. Not only must towns figure out where these structures are, but communities increasingly expect these companies to report on the effects of these facilities on local resources and Who stands to benefit from these complex public-private partnerships. Modern AI data centers demand considerable electrical energy to perform computing functions and cool electronic components, and they can be water-intensive too - either for active cooling technologies or, in regions where supplies are limited, the cooling processes.
At the same time, confidential commercial contracts, difficult permitting pathways, and restricted public disclosure may create significant issues surrounding equity and accountability.
Here is list of major Challenges High electricity needs can be taxing the region's electrical grid Large water usage, when they are tied to cooling technologies, particularly when applied in water-scarce places Less transparency around financing, permit proceedings and environmental considerations Overlapping demands between industrial requirements for resources and communities Possible increases in carbon emissions for facilities using electricity from fossil fuels Development of power infrastructure are postponed Challenges faced as far as using renewable electricity. Strategic Solution Framework Transparency + Resource Efficiency + Clean Energy + Community Partnership + Responsible AI Infrastructure = Sustainable Digital Growth Next Generation of Cooling Solutions Next-generation cooling (e.g. Liquids and closed-loop systems) or the use of outdoor air for cooling where possible is desirable to minimize use of fresh water Resources from Renewables Integrate AI with renewable generation, energy storage technologies, smarter grids AI for Optimisation Use of AI to improve the performance, cooling, energy efficiency and optimisation for water-aware scheduling systems Transparent Communication Publish environmental impact statements (EIS), water usage reporting and efficiency metric data and engage stakeholders on permitting and siting issues The circular use of resources Using and recycling water, reuse wastewater, energy efficiency, utilize the heat from IT equipment Renewable resource integration and planning Integrate data centers to existing and developing power infrastructure including upgrading regional grids and incorporating regional planning