
Related works: AI Data Center Developers Going Public in America Must Disclose Foreign Ownership and Control | AI Data Center Developers Are About to Disclose What State Power Approval Costs · Foreign Capital, Host Competition, and the American Data Center Equilibrium · The MindCast AI Data Center Record (August 2026) · The Authorization Market: Standardized Bargaining, Rationed Power, and the Competition to Build America’s AI Infrastructure (2026) · The Data Center Authorization Price: A 50-State Baseline (2026) · Capital Is the New Computing: Financing the Next Era of AI Infrastructure, 2025–2045 (November 2025) · Power Brokers & Digital Real Estate: How CRE Firms Are Building the AI Infrastructure Backbone (November 2025)
See MindCast AI Data Center Live-Fire Mission
Executive Summary
Wall Street began pricing community data center opposition in July-August 2026. MindCast published the mechanism nine months earlier.
On August 10, Reuters reported that banks and asset managers financing US data centers now weigh local political resistance directly in credit assessment. Karen Fang, who runs infrastructure and sustainable finance at Bank of America, described two underwriting tests: project readiness and credit quality. Fang defined readiness as the permits a project requires plus the support of the people who will live around it. Senior bankers said they now favor projects in states more welcoming to data centers.
MindCast forecast the shift in November 2025 and dated the window. Four calls from the investor and capital work have now settled against outside evidence.
Community trust becomes the decisive site-selection filter — Ship the Workload, Not the Power, September 2025. Gallup reported in May 2026 that roughly seven in ten Americans oppose a data center in their area. Blackstone-owned QTS terminated the Prince William Digital Gateway after sustained local opposition.
Lenders will underwrite energization timing as rigorously as tenant creditworthiness — Power Brokers & Digital Real Estate: How CRE Firms Are Building the AI Infrastructure Backbone, November 2025. Reuters confirmed the practice on August 10. CyrusOne’s $9.7 billion facility releases construction capital only where permits and leases are complete.
Community standing enters financing terms between the third quarter of 2026 and the second quarter of 2027 — Building CRE Coherence for AI Infrastructure: The Integration Imperative, November 2025. The August 10 reportinglanded in the first quarter of that window.
Transformer and transmission scarcity are real; nationwide grid collapse is not — The AI Infrastructure Energy Opportunity Landscape, March 2026. McKinsey confirmed both readings within four months, reporting equipment lead times more than doubled since 2019 and grid connection waits exceeding four years.
The mechanisms settled. The magnitudes did not, and Section II grades both.
The publication carries two claims, and they hold at different strengths. Separating them is the point.
Supported. Authorization risk has become capital-market risk. Uncertainty about permission now changes the timing, probability, and recoverability of the cash flows supporting capital, and lenders price it.
Hypothesised, and testable. Capital structure may also determine how much a state can extract from a developer. A company building from operating cash flow can walk away from a hostile jurisdiction and return in a later session. A company paying interest on drawn construction debt, holding non-cancelable equipment orders, and facing a contractual delivery date cannot.
Capital structure increases a firm’s capability to build, while sufficiently irreversible committed capital decreases its ability to wait.
MindCast names the mechanism the Financing Inversion. Prediction P14 settles it.
What This Publication Adds
A translation layer. States negotiate in tariffs, collateral, minimum-take terms, and months to energization. Credit markets negotiate in coverage ratios, duration, loss severity, and basis points. The conversion between them is what this publication attempts.
Two measurement instruments. Financeable Authorization Coverage measures how much of a project’s committed capacity has cleared every gate it needs. Capital Irreversibility measures how much of its money can no longer move. Together the pair identifies which projects are hold-up exposed — the same question a state asks when deciding how hard to press.
Four live exposures from the last six weeks. Curtailment obligations arriving in June 2027, now carrying an explicit escape price through PJM's bilateral capacity matching. Ownership opacity that sponsors create in the financing room and pay for in the hearing room. A July 29 SEC staff letter that lifted mandatory risk retention from a class of data center securitizations in the same month authorization risk entered credit analysis. And a $500 billion GPU-backed financing platform announced August 10, placing a second collateral assumption — residual hardware value — underneath the same structures.
Evidence that the mechanism already binds. Blackstone-owned QTS terminated the Prince William Digital Gateway after sustained opposition, never approaching lenders for bank financing. CyrusOne’s $9.7 billion facility releases construction capital only where permits and leases are complete. Blue Owl declined a $10 billion Oracle-linked financing in December 2025, weighing Michigan local politics among its reasons.
Prediction Highlights
MindCast generated the predictions below by running the analysis as a MindCast AI Proprietary Cognitive Digital Twin Foresight Simulation across nine behavioral twins — a state government, a grid operator, a county, a community coalition, three developer archetypes distinguished by capital architecture, a bank lender, and a composite creditor. Section XVI states the method; Section XVII carries the full register with settlement sources and falsifiers.
Highest-conviction event predictions.
A top-ten 2026 US project is publicly cancelled or indefinitely paused with permitting or opposition among the stated reasons, by December 31, 2027 — 75–85%.
Data center securitization issuance in 2026 exceeds the 2025 total, by February 28, 2027 — 75–85%.
FERC approves PJM’s Reliability Backstop Procurement in substantially filed form, by December 31, 2026 — 70–80%.
Three or more financings originated after August 11, 2026 disclose permit-to-draw conditions, by June 30, 2027 — 65–75%.
Regulatory concessions get cited by sponsors as evidence of reduced execution risk, by December 31, 2027 — 65–75%.
The instrument test. Projects with less than half their committed capacity fully authorized, and more than sixty percent of their capital already immovable, experience cancellation, delay, or repricing at a higher rate than every other project type — 60–70%. A failure retires both instruments.
Highest-value structural read. Capital concentrates in jurisdictions publishing bounded terms over jurisdictions offering low nominal burden with unresolved rules — 70–80% interpretive.
Provenance. MindCast executed the simulation through an independent Claude implementation of the MP CDT FS runtime. Section XVI states the method and the limits.
A new buyer. Pension funds, insurers, and private credit now hold direct exposure to county zoning boards. None sits at the state bargaining table. None has an instrument for the risk.
What Each Allocator Takes From This Publication
Institutional credit — banks, private credit, infrastructure debt, investment-grade holders. Covenant architecture, rating methodology, curtailment exposure, draw conditions, and sponsor retention after the July 29 staff letter. Predictions P1 through P6 settle on documents these desks already read.
Private equity and infrastructure funds. Irreversibility, optionality, authorization maturity, and project sequencing. Financeable Authorization Coverage and Capital Irreversibility sort a pipeline into four exposure states before capital commits.
Hedge funds and public-equity investors. Capital expenditure exposure, project cancellations, disclosure changes, and the geographic migration of capital. The quarterly settlement cadence in Section XIV matches a public-markets holding period.
Family offices and accredited investors. A usable rule for separating announced infrastructure from financeable infrastructure. Announcement megawatts and authorized megawatts are different assets, and only one of them earns.
Foreign investors and sovereign wealth funds. The sharpest version of the opacity problem. Ownership identity is itself an opposition trigger, so the disclosure remedy that lowers a domestic sponsor’s capital price can raise a foreign sponsor’s authorization price. Section XIII sets out the asymmetry.
Governments deploying capital alongside policy. Extraction has a ceiling. Section VIII names the three boundaries a jurisdiction crosses before it starts raising its own cost of capital.
The publication runs in sequence: what the price is, how it reaches capital, what changed in the last six weeks, how to measure it, what to do, and what MindCast expects to happen. A reader with fifteen minutes should read Sections III, V, and XVII.
I. Two Research Streams and the Gap Between Them
MindCast has worked the AI infrastructure problem from two directions since August 2025. The streams have never been joined, and the gap between them is where this publication operates.
The first stream asked what states charge for permission. Beginning with The Bottleneck Hierarchy in U.S. AI Data Centers in August 2025, MindCast established that electricity, network topology, and cooling set the physical limits on AI infrastructure. The Authorization Market then defined permission to build and operate as an economic good carrying a price, and The Data Center Authorization Price: A 50-State Baseline measured that price in every state on one instrument. Nothing in that work required a reader to know anything about credit markets.
The second stream asked what institutional behavior earns in the credit market. Capital Is the New Computingestablished that infrastructure requires financing durable enough to match a twenty-year asset life. Power Brokers & Digital Real Estate and Building CRE Coherence for AI Infrastructure, both November 2025, modeled twelve platforms and found that developers whose behavior stays consistent under pressure deliver on schedule while inconsistent ones run roughly fourteen months late and twenty-two percent over budget. Nothing in that work required a reader to know anything about state legislatures.
Neither stream asked the joining question: what happens to the authorization price once it enters a project’s capital structure, and how does that structure change the firm’s position at the state bargaining table?
Appendices B and C list both bodies of work for readers who want the underlying studies. No claim in this publication requires them.
The gap matters because an authorization requirement carries no single economic value.
A six-month delay means one thing to a project whose major capital remains undrawn. The same delay means something else entirely to a project carrying billions in construction financing.
A fifteen-year minimum utility commitment means one thing to an investment-grade hyperscaler serving diversified demand. The same commitment means something else to a single-purpose vehicle depending on one tenant, one campus, one energization date, and one refinancing path.
The law is identical in each pair. The financial consequence is not. Closing that gap is the work of the sections below.
II. The November 2025 Forecast and What Settled in August 2026
MindCast grades its own record before extending it. Four dated claims from the Capital stream reached settlement this month, and the grade is mixed by design.
November 2, 2025 — Capital Is the New Computing: Financing the Next Era of AI Infrastructure, 2025–2045. MindCast named the interval between funding commitment and energization as the emerging efficiency benchmark and called it liquidity latency. Projects with documented community engagement, the study found, close financing 40 to 60 percent faster than projects treating stakeholder relations as an afterthought.
November 3, 2025 — Power Brokers & Digital Real Estate: How CRE Firms Are Building the AI Infrastructure Backbone. The study stated that no project reaches financial close without proof of firm power, and that lenders had begun underwriting energization timing as rigorously as tenant creditworthiness. Projects with strong community standing showed a 15 to 20 percent permitting advantage. Phoenix water backlash extended timelines nine months; proactive transparency in the Carolinas halved them.
November 13, 2025 — Building CRE Coherence for AI Infrastructure: The Integration Imperative. The study forecast that by the fourth quarter of 2026, lenders would fold execution-consistency measurement into a material share of infrastructure deal covenants, and that projects without a verified track record would face 50 to 75 basis point penalty pricing. The forecast placed the shift in a window running from the third quarter of 2026 through the second quarter of 2027.
August 10, 2026 — settlement. Reuters reported that banks now weigh permitting readiness and community support directly in project credit assessment.
Three independent measurements explain why lenders moved. Data Center Watch counted at least 75 projects worth roughly $130 billion facing local opposition in the first quarter of 2026 alone, with opposition groups rising from 396 to 833 across 49 states. Carbon Direct found 46 projects worth $170 billion delayed or cancelled across 20 states, naming transparency failure as the leading cause. Gallup found in May that roughly seven in ten Americans oppose a data center in their area.
The Grade
Mechanism: externally confirmed. The August 10 reporting confirms the qualitative mechanism inside the forecast window. Community sentiment and permitting readiness now function as credit variables in institutional underwriting, as stated nine months in advance. Interpretive confidence: 85–92%.
Quantitative predictions: open. Nothing in the reporting settles the basis-point effects, the scoring thresholds, or the causal magnitude. Project-level pricing differentials are not publicly observable, the share of deal covenants incorporating a consistency measure stays undisclosed, and whatever instrument lenders use is proprietary. Interpretive confidence that the magnitude claims settle within the stated bands: 40–55% — insufficient to claim.
Reporting the numbers as confirmed would overclaim. The mechanism is what the record confirms, and the mechanism is what the rest of this publication builds on.
III. Authorization Has Two Prices
Every data center pays twice for permission. One price is visible in the permit file. The other is visible only in the capital structure, and the second price can exceed the first.
Each price is denominated in the currency of the party charging it, which is why the two rarely meet on the same page.
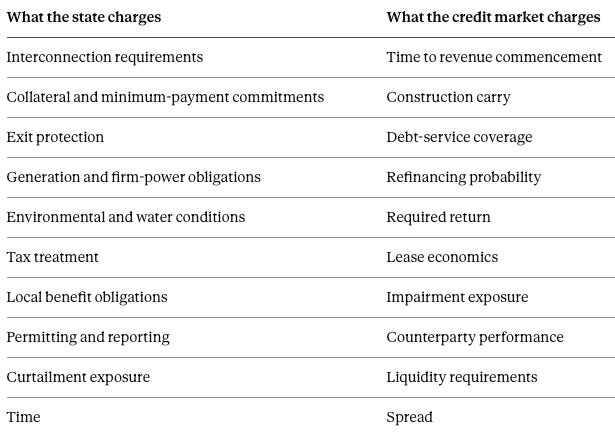
Read across any row and the translation problem appears. A state imposing a fifteen-year minimum-payment commitment is setting a duration; a lender reading the same term is setting a coverage ratio. Neither party writes down the other’s number.
The proposition joining the two is a translation rather than an accounting identity:
The authorization price becomes a credit spread when authorization uncertainty changes the probability distribution of the cash flows supporting capital.
Five components carry the translation. MindCast groups them as Authorization Credit Exposure (ACX):
ACX = Expected Delay Carry + Expected Cancellation Loss + Refinancing Exposure + Contractual Exposure + Repricing Cost
Expected Delay Carry — interest, leases, labor, equipment commitments, and site costs incurred while productive operation stays blocked.
Expected Cancellation Loss — stranded site development, non-redeployable equipment, terminated contracts, impairment. Blackstone-owned QTS terminated its Prince William Digital Gateway project in Virginia after sustained local opposition, and did not approach lenders for bank financing on the project at all. A privately capitalized developer will end a multibillion-dollar program rather than pay an authorization price that has climbed past the return.
Refinancing Exposure — the risk that delay pushes a project across a maturity, bridge, warehouse, or construction-financing boundary.
Contractual Exposure — penalties and lost economics tied to tenant delivery, power obligations, and dated customer promises.
Repricing Cost — the additional return lenders demand once perceived authorization risk changes.
Calibration must precede any use of ACX as a scoring instrument. The code carries an X rather than an E to avoid collision with an existing equilibrium concept in the MindCast registry — a discipline the firm applies to every new metric before publication. One implication is available immediately:
The same statute imposes different credit prices on different capital structures.
Regulatory economics cannot stop at the legal term. Credit analysis cannot begin at the bond. The transmission mechanism between them is the object worth measuring, and the following sections measure three components of it.
IV. Liquidity Latency Is a Jurisdictional Variable
MindCast defined liquidity latency in November 2025 as the interval between funding commitment and energization, and found that projects energizing within six months command a 10 to 15 percent return premium over projects taking twelve to eighteen. The original formulation treated latency as a property of the developer. Latency is substantially a property of the jurisdiction.
The conversion chain runs in one direction and breaks at any link: site → authorization → interconnection → firm power → construction → energization → utilization → revenue.
Capital enters before the chain completes. Every remaining link therefore carries the possibility that latency moves after the financing assumptions have locked.
A capital committee underwriting a 2028 revenue start does not experience a 2029 start as regulatory friction. The committee experiences another year of carry, another year before depreciation-producing assets generate revenue, a probable refinancing, tenant and lease mismatch, hardware obsolescence risk, and a revised judgment about management’s execution credibility.
Physical constraints set the floor. McKinsey reported in June 2026 that lead times for generators, chillers, transformers, and switchgear have more than doubled since 2019, with some exceeding three years, and that average grid connection waits now exceed four years and reach a decade in some markets. MindCast's own energy work identified transformer manufacturing as the narrowest chokepoint in the entire stack.
Authorization variance sits on top of the floor, and jurisdictions control it directly. Two states with identical grid conditions can produce twelve months of difference through permitting design alone.
Measuring that variance in months is settled work — every state already carries a score. Measuring it in basis points is what this publication attempts, and the three sections that follow identify the exposures that make the measurement urgent.
Contact mcai@mindcast-ai.com to partner with us on Predictive Game Theory AI in Law and Behavioral Economics. We specialize in predictive simulations for Complex Litigation, Innovation Economics, Geopolitical Risk Intelligence and Legacy Innovation. See more about MindCast series at our new website MindCast Corporate.
To test our predictive simulation AI system, in 2026 we simulated the Super Bowl and the World Cup. See 🏈 Super Bowl LX — AI Simulation vs. Reality | ⚽ The 2026 World Cup Final Simulation Validation
To deep dive on MindCast works upload the URL of this publication into any LLM (preferably Google AI mode) and prompt ‘reconstruct MindCast framework with three degrees of cited sub links.’ See Live-Fire Game Theory Simulators, Runtime Predictive Infrastructure.
V. Curtailment Becomes a Credit Exposure in June 2027
Grid access changed character in 2026. Connection used to be a construction milestone that a project cleared once. Connection is becoming a continuing condition of service that a project can lose, and the financing materials reviewed for this publication do not price the difference.
The PJM board directed two filings on July 27, 2026, submitted to FERC on July 31 under Section 205 of the Federal Power Act. One establishes a Reliability Backstop Procurement addressing capacity shortfalls in the 2027/2028 and 2028/2029 auctions, which PJM attributes primarily to the addition of large loads and data centers. The other places new large loads that neither bring new generation nor otherwise secure supply into curtailment during capacity shortages, ahead of measures affecting other customers.
PJM defines a large load as an end-use customer drawing 50 MW or more at a single interconnection point, or across multiple points within a one-mile radius, and will maintain a registry of them.
Texas began auditing generation plans and ERCOT reliance days later. FERC’s June 18 show cause orders direct all six regional operators to address cost shifting, transmission cost transparency, co-location, and behind-the-meter generation.
Supply-or-curtail changes what a lease is worth.
A lease priced on assumed availability, financed by construction debt serviced from that lease, and rated on contracted revenue now carries a regulatory right of interruption held by a party outside the contract.
The chain is short and each link is a credit concept. Curtailment risk is uptime risk. Uptime risk is revenue risk. Revenue risk is debt service risk.
Public financing materials reviewed for this publication did not identify a dedicated curtailment reserve, curtailment covenant, or curtailment-adjusted debt-service coverage ratio.
Where the exposure lands depends on a lease term nobody has tested. A hyperscaler absorbing curtailment loses compute. A developer absorbing curtailment may breach a service-level agreement to a tenant who then withholds rent that services debt.
Which outcome occurs turns on whether standard triple-net data center leases and hyperscale take-or-pay contracts classify a regional grid capacity shortage as force majeure or as landlord default. Force majeure treatment pushes the revenue risk onto the tenant and largely spares the developer’s debt service. Default treatment routes the loss straight to coverage ratios.
Many leases currently in force predate PJM’s 2026 framework, which leaves the allocation unsettled across a large share of contracted capacity. Counsel reviewing a portfolio should read the force majeure clause before reading the coverage covenant.
Escaping the queue now carries an explicit price rather than an abstract advantage. PJM will reduce the backstop procurement target to reflect documented bilateral contracts and self-supply arrangements delivering net-new capacity for new load, and allocate the residual cost to load-serving entities across a fifteen-year commitment term. PJM opened bilateral matchmaking on June 9, 2026 and expected initial matches in August.
A data center that signs a documented contract for new generation shrinks the procurement and its own zone’s share of the bill. A data center that does not pays through its utility and accepts curtailment exposure on top.
Secured generation therefore stops being an operating choice and becomes a cost-allocation variable that a lender can price at underwriting.
MindCast named secured firm power as the decisive advantage in August 2025, and the CRE simulations found that generation-owning firms outperform power-purchase-dependent competitors whenever utilities face capacity constraints. Supply-or-curtail converts that operating advantage into a financing advantage with a dated deadline attached.
Equipment lead times closed the decision window before the rule takes effect, which means the June 2027 threshold will sort projects that already made their choice.
Interpretive confidence that curtailment enters project credit analysis as an explicit variable within four quarters: 60–70%.
Curtailment is the clearest case in the publication of an authorization-layer rule converting directly into a credit variable. A grid operator, acting under federal review, can now reduce the revenue a financed asset produces — and the contracts governing who absorbs that loss were written before the rule existed.
VI. The Financing Inversion — A Stated Hypothesis
Why the status is a hypothesis. No sponsor states the mechanism and none would, so the read rests on inferred conduct. One transaction carries the behavioral evidence. Project quality, demand strength, and political skill all confound the relationship between leverage and concession. Prediction P14 supplies the test.
Conventional intuition treats money as leverage at a negotiating table, and usually the intuition holds. A counterparty with more cash, better market access, and a stronger balance sheet makes larger commitments and absorbs more adverse outcomes.
Data center construction introduces a second phase where the intuition reverses.
Before commitment, capital expands choice. A firm buys land, orders equipment, reserves generation, negotiates from several sites at once, shifts a project between regions, and credibly threatens to walk.
After commitment, capital contracts choice. Drawn debt accrues interest. Custom facilities resist repurposing. Equipment and power orders become non-cancelable. Tenant dates approach. Local construction begins. Financing maturities keep moving even when permitting stops.
Political delay acquires a price the moment the second phase begins.
The variable governing the reversal is Delay Tolerance, and it rises with liquidity, operating cash flow coverage, undrawn capital, and geographic optionality, while falling with drawn project debt, fixed carry, contractual deadlines, refinancing pressure, and irreversible commitments.
The same capital commitment that increases a firm’s capability to complete a data center decreases its capability to resist delay once the commitment becomes irreversible.
Why Capital Sequencing Matters More Than Previously Stated
MindCast’s CRE simulations found that firms closing financing only after interconnection agreements execute achieve better execution and tighter spreads, and attributed the gain to avoiding idle capital.
The gain is larger than the original attribution captured. Sequencing capital behind authorization preserves the ability to walk away, and the ability to walk away preserves the reservation price in every subsequent negotiation with a state, a utility, or a county.
Timing beats speed for a financial reason and a bargaining reason. Only the first has been named.
Three Postures, Three Clocks
Three architectures dominate the market, and the same authorization shock costs each of them something different.
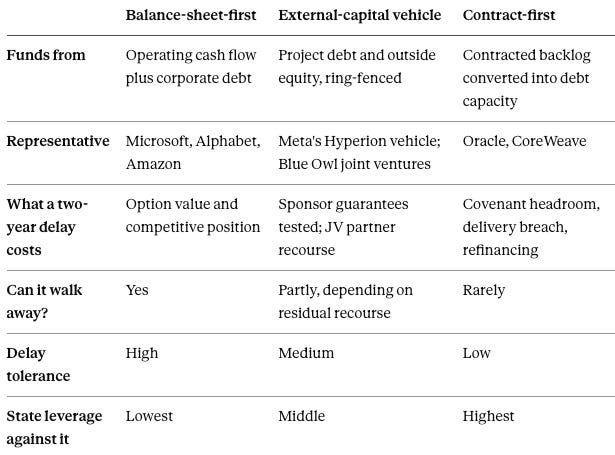
The bottom two rows carry the finding. State leverage rises as delay tolerance falls, and delay tolerance falls as capital becomes irreversible — which is why the largest sponsor at a hearing is not always the strongest one.
Oracle runs the most exposed position visible. Remaining performance obligations reached $638 billion at the close of fiscal 2026, up 363 percent year over year, against negative free cash flow of $23.7 billion and capital expenditure of $55.7 billion. The company raised $43 billion in debt and $5 billion in equity during the year, absorbed an S&P downgrade to BBB−, and concentrates roughly $300 billion of backlog in a single counterparty. Oracle also disclosed $75 billion of prepaid and customer-supplied hardware — counterparty commitment converting directly into financing capacity.
Meta distributes financing outward while retaining contractual exposure. The Hyperion vehicle raised approximately $29.5 billion in the largest non-merger high-grade bond sale on record, with PIMCO taking roughly $18 billion and Blue Owl Capital participating as joint venture partner on the Louisiana campus. JPMorgan and Morgan Stanley separately managed a $12.3 billion bond sale for BlackRock as Meta’s partner on an El Paso project.
Diversified hyperscalers funding from internal cash occupy the strongest position and face the least pressure to concede.
One transaction shows the mechanism operating early. In December 2025, Blue Owl Capital did not proceed with a contemplated $10 billion financing for the Oracle-linked Saline Township campus in Michigan after the parties failed to reach terms. Reporting by the Financial Times and Reuters attributed the breakdown to tougher leasing and debt terms demanded by lenders, lease economics less favorable than Blue Owl’s earlier Oracle deals, mounting scrutiny of Oracle’s leverage — and concern that local politics in Michigan would delay construction.
Oracle disputed the characterization, stating that its development partner Related Digital had selected a different equity partner from a competitive field and that negotiations were on schedule.
The dispute over the deal’s status does not affect the analytical point. A private credit firm weighed local political delay risk in a funding decision in December 2025, eight months before Reuters reported the practice as general across the lending market.
The Reservation-Price Consequence
A rational firm concedes until the marginal cost of another concession exceeds the expected cost of the delay that concession avoids.
Suppose a state asks for $150 million of additional system investment. The correct corporate question is not whether $150 million is expensive. The question is whether refusing produces an expected delay cost above $150 million.
An identical legal term therefore destroys value at one project and creates value at another. Which outcome occurs depends on the capital structure, not the statute — and the next section follows the consequence to the state side of the table.
VII. The State-Extraction Hypothesis: Why Low Delay Tolerance May Raise the Price a Firm Accepts
A state looking at a large proposed campus sees enormous corporate capability and assumes a difficult counterparty. The assumption may be backwards.
Capability and negotiating flexibility move independently. A $20 billion project carries more economic power than a $2 billion project and simultaneously more exposure to a six-month delay.
States do not need a private financing model to find the difference, because reservation prices leak through conduct.
A developer under timing pressure offers additional infrastructure, accepts longer contractual terms, expands collateral, strengthens community benefits, funds dedicated generation, agrees to enhanced reporting, accepts larger exit protections, or trades economics for a dated path to energization.
A less constrained counterparty declines, resizes, relocates, or waits for the next session.
The hypothesis is testable as written:
Holding project quality and expected demand constant, lower delay tolerance correlates with a higher authorization price accepted by the applicant.
Interpretive confidence in the direction: 75–85%, held below release. The direction is argued, not established.
A correction the simulation forced. Arbitration across the twin network found that structural constraint, not sponsor conduct, is the binding cause of authorization outcomes over the forecast horizon. Physical and capital constraints — transformer lead times beyond two years, interconnection waits beyond four, the June 2027 supply threshold, and capital already drawn — govern outcomes more than sponsor posture does through 2027. A sponsor that decides today to change its conduct still cannot change its lead time, its queue position, or its committed capital.
The tier-one levers in Section XV remain correct and nearly free. Their expected effect over the next eighteen months is smaller than a conduct-dominant reading would suggest.
Financing Posture: The Missing Bargaining Column
MindCast’s bargaining architecture currently scores firms on resources and conduct. Seven inputs determine how much regulatory delay a project can absorb, and none appear in the current framework.
Funding source — operating cash flow, corporate debt, project debt, SPV or JV financing, private credit, customer prepayment, or mixed.
Cash-flow coverage — whether existing operations fund the investment comfortably or the project depends on future earnings.
Draw status — how much project capital remains optional versus already funded or committed.
Duration match — whether financing maturities exceed realistic authorization and construction timelines.
Contract coverage — how much future revenue rests on enforceable customer obligations.
Geographic optionality — whether capital and demand can migrate to an authorized site elsewhere.
Irreversibility — how much committed capital loses value if the project delays, resizes, or moves.
Financing Posture does not replace the existing Capability Bundle. Financing Posture changes what the Capability Bundle means, because a financially powerful firm can score high on capability and low on delay tolerance at the same time.
For a state, the practical instruction is simple: the terms available depend on which sponsor is asking, and the answer sits in the sponsor’s financing structure rather than its public commitments.
VIII. The Limit on State Extraction
Extraction works, and extraction has a ceiling. States that miss the ceiling damage their own future market, and the damage arrives with a lag long enough to escape political accounting.
Rising authorization costs eventually push a project across one of three boundaries.
The return boundary — expected project return falls below the investor’s hurdle rate.
The financing boundary — lenders no longer fund the structure on acceptable terms.
The optionality boundary — another jurisdiction becomes more valuable despite relocation cost.
A state therefore maximizes value below a project-killing threshold. The optimal authorization price is not zero. The optimal price is also not the maximum concession available from the most desperate bidder in the queue.
Repeated extraction above the frontier raises the jurisdiction’s own future cost of capital. Investors learn. Developers reroute pipelines. Tenants demand alternatives. Utilities lose credible load.
MindCast’s Regional Integration analysis documented the dynamic before the current legislative wave. Northern Virginia’s score fell as trust eroded and project timelines stretched from roughly eighteen months toward twenty to thirty-six, while trust-rich regions absorbed the displaced demand. Arizona showed how one constraint failure — water — undermines otherwise strong power infrastructure.
Jurisdictional reputation behaves like a priced asset that depreciates. A state can win a bargain and lose a market in the same session.
IX. The Opacity Loop: SPV Structures Manufacture Permitting Risk
The most damaging structural pattern in the 2026 record is one the industry created for good reasons and cannot escape alone.
Special-purpose vehicles, joint ventures, and layered ownership protect corporate ratings, isolate project risk, and preserve negotiating leverage during site acquisition. Every purpose is legitimate. Every purpose is achieved.
The same structures produce ownership opacity. Carbon Direct examined 46 delayed or cancelled projects worth $170 billion across 20 states and found transparency failure the most common cited cause — specifically nondisclosure agreements signed by elected officials, complex ownership chains, and undisclosed power and water requirements.
Lenders now price the opposition that results, and two disclosures from the August 2026 reporting show the pricing already operating.
CyrusOne carries a $9.7 billion warehouse and revolving credit package arranged by Morgan Stanley, TD Securities, KKR Capital Markets, and Wells Fargo. Part of the facility funds new construction only if all permits and leases are in place. The company faces resident opposition to a $500 million project in Sangamon County, Illinois.
Compliance runs continuously rather than at close. Builders must demonstrate before each drawdown that a project still satisfies the financial covenants and monitoring requirements agreed with lenders. Permitting failure therefore stops capital mid-construction, not only at origination.
The loop closes:
Financing architecture chosen to reduce credit risk manufactures the permitting risk that raises it.
MindCast measured the effect in November 2025 without identifying its source. Phoenix water backlash extended permit timelines nine months; proactive transparency in the Carolinas halved them. Transparency already registered as capital efficiency.
What earlier work treated as a communications variable is substantially a structural one. Ownership arrangements that trigger opposition get chosen in the financing room, not the community affairs office.
Why Advice Will Not Fix It
Naming the loop as an equilibrium rather than a mistake determines the remedy, and the distinction is not academic.
No single sponsor discloses its ownership chain first. Unilateral transparency surrenders negotiating position while competitors stay opaque, and delivers a benefit — lower spread — that arrives only once disclosure becomes general. Non-disclosure holds as a stable best response for every player.
Equilibria of that shape break only under force applied to all sponsors at once. Three candidates exist: a lender covenant applied uniformly, a state statute compelling identification of the ultimate parent, or a rating agency criterion naming ownership disclosure as a rating factor.
Compelled disclosure costs developers something real, and less than they assume. Naming the ultimate parent on an application invites land-cost inflation, since sellers price against a known deep-pocketed buyer. Set that cost against the alternative. Permitting delay accrues continuously against drawn capital, while a land premium is paid once at acquisition. A universal rule also equalizes the penalty, since every competitor faces the same seller.
Texas ran the experiment in an adjacent field. The state asked data centers to report power and water use. Fewer than ten percent complied. Governor Abbott then halted approvals inside the ERCOT interconnection process and made the audit a condition of grid access.
Voluntary disclosure failed. Attaching grid access as a consequence changed the obligation from a request into a condition of project progression. An equilibrium reading predicts exactly that sequence; an error reading does not.
Texas carries a second lesson for capital. Approvals stopped with no stated end date, under public federal pressure, in the jurisdiction that had served as the permissive benchmark. A sponsor cannot price an indefinite pause, and unpriceable variance in a welcoming state deserves more attention than demanding terms in a hostile one.
Interpretive confidence that the loop operates as described: 70–80%. Confidence that it survives testing against opposition rates sorted by ownership structure: 60–70%.
The practical reading for an investor is short. A sponsor cannot fix ownership opacity alone without losing ground to peers who do not, so the fix arrives from a lender, a rating agency, or a statute — and whichever arrives first resets the cost of capital for every sponsor at once.
X. The SEC Staff Reclassification of Data Center Securitizations
A staff action in late July 2026 removed the mandatory alignment backstop from a fast-growing data center financing channel. The timing, rather than the action itself, is what deserves attention.
On July 29, 2026, the SEC's Division of Corporation Finance issued a staff interpretive letter responding to a request from Latham & Watkins, concluding that securities issued in the described data center securitizations are not asset-backed securities under Section 3(a)(79) of the Securities Exchange Act. The staff reasoned that data center facilities are tangible operating assets enduring beyond the tenor of the securities, rather than self-liquidating financial assets.
Characterize the action precisely. A staff interpretive letter is not a Commission rule or statement and carries no independent legal force. The letter binds nothing and reflects the staff’s view on the facts presented.
The practical consequence still reaches Regulation RR risk retention, Rule 192, Rule 15Ga-1, and Rule 15Ga-2, which generally require a five percent retained interest for covered asset-backed securities.
Mandatory federal risk retention no longer supplies the alignment backstop for structures falling within the staff interpretation.
Retention exists to align sponsor and investor interests, and the backstop came off in the same month lenders began pricing permitting status and community opposition as credit variables.
Scale makes the timing consequential. Data center asset-backed and mortgage-backed issuance passed $25 billion in 2025, up from $2.4 billion in 2020, and 2026 is pacing toward another record. MindCast forecast in November 2025 that green and infrastructure-backed securities would reach $150 to $200 billion in annual issuance through 2028. Regulatory friction has now been removed from the vehicle that forecast identified.
Two considerations bound the concern. Sponsors have typically retained around 30 percent of these structures against a 5 percent requirement, so the near-term practical effect may prove modest — market demand, not regulation, has been the binding constraint. The guidance also removes genuine compliance friction that participants argued never fit the asset class, and lower friction lowers the cost of infrastructure the country has decided it wants.
A second collateral question arrived the same week. On August 10, 2026, Nvidia announced memorandums of understanding with six major financial institutions to mobilize more than $500 billion in third-party capital for AI infrastructure, structured as long-term debt and asset-backed financing for customers buying GPUs and building data centers. Jensen Huang characterized the platform as addressing circular-financing concerns directly, stating that the capital is not Nvidia revenue and that demand is real. The initiative targets precisely the sponsors this publication identifies as least able to wait — buyers without the credit rating or cash to purchase silicon outright. Two collateral assumptions now sit underneath the same financing structures. The first is that a data center's authorization will hold, which this publication argues is underpriced. The second is that GPUs retain value over a debt tenor, which analysts have questioned on depreciation grounds and which Nvidia counters by pointing to software updates preserving useful life. Nvidia's five-year credit default swap spread roughly doubled between late May and August 10. A project can service its debt only if both assumptions hold, and neither is settled.
The forward risk is the combination, not the letter. A financing channel growing rapidly. Sponsor alignment now voluntary for qualifying structures. Ownership structures that generate the opposition lenders have just started pricing. And a curtailment regime arriving in June 2027 that no reviewed offering document addresses.
Each element is defensible alone. The four together describe a channel where authorization risk migrates toward the holders least equipped to observe it.
Status of the consequence. The regulatory fact is settled and dated. The consequence is not. Thirteen days is insufficient time for observable sponsor behavior, and the voluntary retention noted above remains a live alternative explanation. The combination is monitored, not forecast.
Interpretive confidence that the combination raises system-level exposure: 65–75%, held below release for insufficient causal integrity. Prediction P15 supplies the observable test.
A fixed-income holder buying into this channel should ask one question the offering document may not answer: how much of the deal is the sponsor keeping, and why.
XI. Two Instruments: Financeable Authorization Coverage and Capital Irreversibility
Credit markets need a way to separate capital committed behind mature authorization from capital committed behind hope. Two ratios do the work, and the pair matters more than either alone.
Financeable Authorization Coverage (FAC) divides financially committed megawatts that have cleared every material authorization gate by total financially committed megawatts. The numerator is a subset of the denominator by construction, so the ratio necessarily runs from 0 to 1. The name avoids collision with an existing conversion metric already registered under the ACR code.
A project financing 1,000 MW with 800 MW through all material gates carries a FAC of 0.80.
Thresholds. Low FAC is below 0.50. High CIR is above 0.60. Both govern the settlement of Prediction P13. A company announcing 10 GW while committing capital only after approvals retains strong coverage. A company committing billions against early-stage sites carries weak coverage despite an impressive pipeline.
Materiality governs the FAC numerator, and the rule is binary rather than proportional. Any unresolved critical-path gate — power service, interconnection, zoning, environmental authorization, water allocation, or a state construction prohibition — drops the associated capacity out of the numerator entirely. A project holding an executed interconnection agreement but missing a county water allocation scores that capacity at zero, not at a partial credit.
Non-critical items score nothing against the ratio. A pending landscaping permit does not reduce coverage, because a landscaping permit cannot stop energization.
The Model Authorization Code supplies the hierarchy that separates the two categories; the financial model supplies the denominator.
Capital Irreversibility Ratio (CIR) divides non-cancelable or materially stranded capital by total project capital.
Numerator rule. The numerator counts capital already disbursed, plus contractual commitments carrying a termination penalty above 25 percent of committed value, plus site-specific works with no redeployment path. Equipment orders transferable to another site of the same sponsor do not count.
Together the two ratios sort projects into four states.
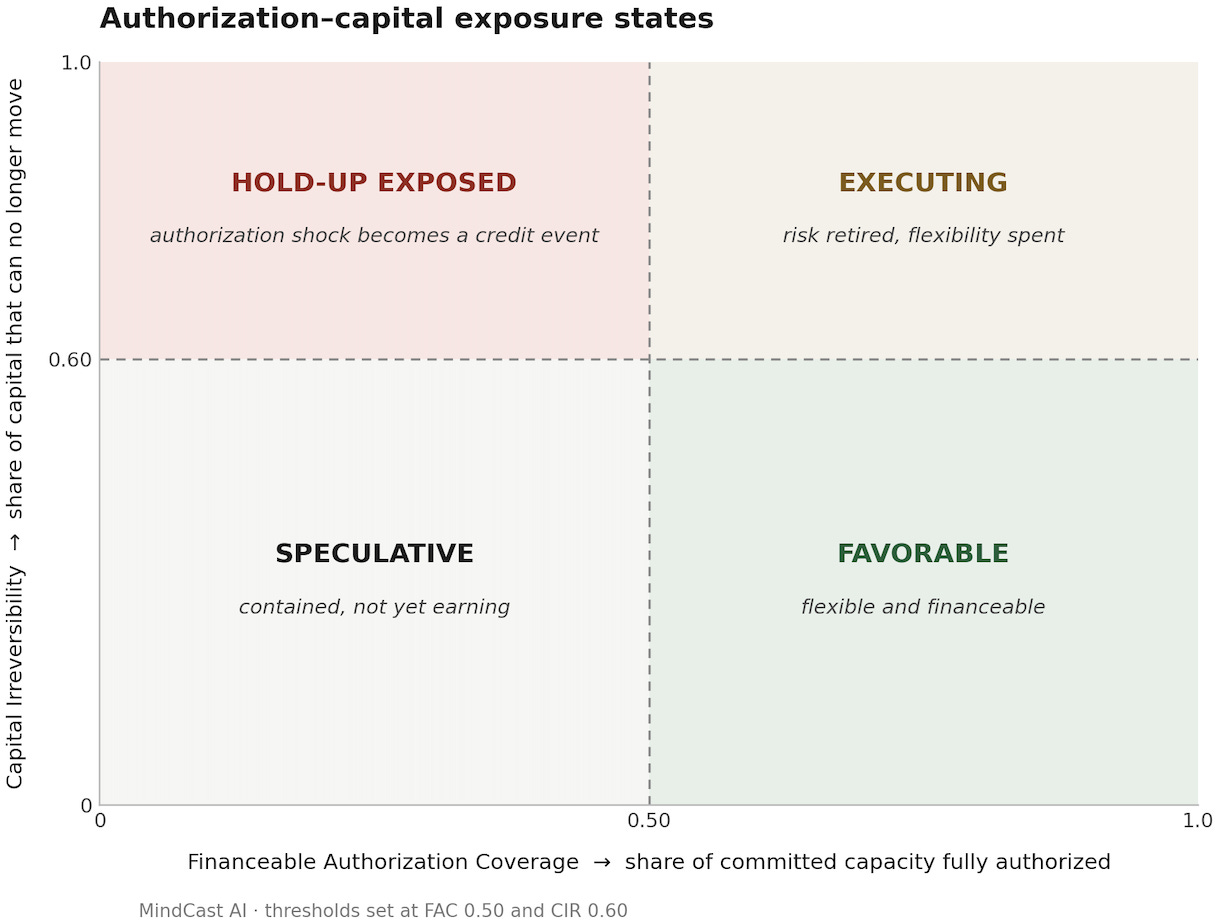
The fourth quadrant should concern capital providers and governments equally. Quadrant four identifies the project most likely to convert an authorization shock into a credit event, and simultaneously the project from which a state can extract the most.
Lenders already enforce a crude version of the ratio. The CyrusOne facility releases construction capital only against completed permits and leases, which is Financeable Authorization Coverage applied as a covenant rather than a score. Formalizing the measurement lets a creditor compare projects rather than police one.
Both ratios measure a project. MindCast’s earlier work measured firms, asking whether an institution executes what it says. The two questions are different and both matter: a disciplined sponsor can still hold a project that has not earned the right to be built.
Neither instrument is validated. Prediction P13 tests whether the pair actually sorts risk, and a failure there retires both.
XII. Delay Tolerance Enters the Bargaining Equation
MindCast’s existing framework scores a firm’s bargaining position at a state table on two things: the capability it brings — capital, clean power, demand credibility, execution record — and a discount for past conduct, since a sponsor that broke a prior commitment gets worse terms. Call the first the capability bundle and the second the conduct discount.
The finance layer adds a third term the framework did not carry. Time.
Delay tolerance resolves into one classification:
High — the project can defer, relocate, resize, or absorb a prolonged authorization period without material financing impairment.
Medium — delay raises cost and may alter returns without threatening financing viability.
Low — material delay creates refinancing, covenant, contractual, liquidity, or impairment risk.
Delay tolerance enters as a separate multiplier rather than as part of capability:
Effective Bargaining Position ∝ Capability Bundle × Delay Tolerance × (1 − Conduct Discount)
Geographic optionality — whether the sponsor can move the project elsewhere — sits inside delay tolerance rather than beside it, which keeps the expression to three terms.
Calibration remains pending, and the correction stands without it. A sponsor with the strongest capability in the market can still bargain from the weakest clock, which is why capability alone predicts terms poorly.
XIII. Creditors Hold the Exposure and Have No Seat
Analysts describe data center regulation as a contest among developers, hyperscalers, utilities, regulators, lawmakers, local governments, and communities. The description is no longer complete.
A growing share of the economic exposure now sits with bondholders, infrastructure funds, pension funds, insurers, private credit lenders, and securitization investors. Banks reached concentration limits and passed the paper onward to exactly those holders.
Banks already fold permitting readiness and local political risk into underwriting. The July 29 SEC staff letter opens another pathway for infrastructure cash flows to reach fixed-income markets, and opens it with sponsor retention now voluntary for qualifying structures.
Creditors do not sit at the state authorization bargaining table. Their influence arrives indirectly, through credit agreements, draw conditions, required returns, lease structures, financing maturities, and willingness to fund the next project.
Foreign and sovereign capital carries the exposure in its sharpest form. A pension fund holding project debt is anonymous to a county hearing. A sovereign wealth fund or foreign strategic investor is not, because ownership identity becomes an argument at the hearing rather than a line in a filing.
The consequence inverts the remedy. Disclosing the ultimate parent lowers a domestic sponsor’s capital price by removing the leading cited cause of cancellation. Disclosing a foreign or sovereign parent can raise the authorization price instead, by handing organized opposition its most effective argument.
Sovereign and foreign allocators therefore face a disclosure equilibrium that binds harder than it binds anyone else, alongside national-security review that domestic capital does not encounter. Both effects compress the jurisdictions where that capital can deploy at an acceptable authorization price, and neither appears in conventional country-risk analysis.
Interpretive confidence in the asymmetry: 65–75%.
Three parties ask three different questions about the same regulatory event.
A government affairs team asks what the state will require. A developer asks what to concede. A creditor asks:
How does the state’s next move change the probability distribution of the cash flows supporting my capital?
Political risk analysis rarely reaches the data center tariff clause. Credit analysis rarely models the state legislative bargaining that produces it. Bankers leaning toward welcoming states are running an unmeasured version of a fifty-state comparison that already exists in published form — which is the commercial gap this publication identifies.
Does Financing Volume Rise or Fall From Here?
Every allocator reading the analysis above asks the same question, and the framing hides the useful answer. Volume rises. Velocity falls. Dispersion widens. Three separate movements, and only the third is investable.
Volume rises, and not because capital expenditure rises. The funding mix is shifting from operating cash flow toward external capital. Debt already funds roughly a third of hyperscaler capital expenditure and is heading toward 35 percent against $1.14 trillion of spending in 2027. A flat capex year still produces more issuance under that shift. Securitization compounds the effect: data center asset-backed and mortgage-backed volume climbed from $2.4 billion in 2020 to past $25 billion in 2025, and the July 29 staff letter lowered the compliance cost of that channel in the same month authorization risk entered credit analysis.
Velocity falls, which is the part most forecasts miss. Permit-to-draw conditions leave committed capital undrawn. Four categories that used to move together have separated — announced, committed, drawn, and deployed — and a project can sit in the second for years. Estimates already place $150 to $200 billion of 2026 spending slipping into 2027 and 2028.
Dispersion widens, and dispersion is where the money is. Authorization risk does not shrink the total. Authorization risk reroutes it. Projects carrying a complete authorization stack finance faster and cheaper. Projects without one finance slower, wider, or not at all. QTS terminated Prince William without approaching lenders. Blue Owl declined the Michigan financing while continuing to fund other campuses for the same sponsor. Neither event reduced sector issuance; both moved it.
What would actually reverse the volume. Permitting fights cannot shrink the aggregate on their own — they change who gets financed and at what price. Only a demand revision does that. Three indicators settle the question in order: contracted backlog quality at the concentrated sponsors, capital expenditure guidance at the four largest buyers, and whether pre-lease ratios hold near current levels.
Interpretive confidence in the volume-up, velocity-down, dispersion-widening read: 70–80%. Confidence that a demand revision rather than an authorization event is the binding reversal risk: 65–75%.
An allocator worried about the sector shrinking is watching the wrong variable. The sector bifurcates well before it contracts.
XIV. Capital Markets Settle Predictions Every Quarter
The finance layer delivers a methodological benefit that has nothing to do with the subject matter.
Legislative predictions settle slowly. A session, an election, a commission case, or a multiyear build cycle can take eighteen months to resolve.
Capital markets settle every quarter. Capital expenditure guidance, free cash flow, debt issuance, spreads, credit-default swaps, rating actions, remaining performance obligations, backlog, lease commitments, financing closings and cancellations, construction slips, impairments, depreciation changes, and authorization disclosures all arrive on a fixed clock against named sources.
Pairing the two produces separate contracts from a single event. A regulatory prediction names a jurisdiction changing the authorization price. A capital prediction names an exposed firm changing financing, disclosure, project timing, or contractual structure within a specified number of quarters.
The two settle independently. A regulatory hit cannot rescue a financial miss, and a financial hit cannot retroactively validate a regulatory miss.
Section II applies the discipline to MindCast’s own record, where the mechanism settled and the magnitudes did not. Separation of that kind strengthens a falsification architecture rather than diluting it.
XV. Recommended Actions by Stakeholder
Each party can act on the analysis above without waiting for the others, and the highest-value actions differ sharply by role.
Hyperscalers
Treat authorization maturity as a capital allocation variable before committing irreversible spending.
Build geographic substitutability, which functions as regulatory insurance and protects the reservation price at the same time.
Disclose the development pipeline by authorization maturity rather than announcement value — announced, site-controlled, power-secured, materially authorized, under construction, energized. A portfolio of 20 gigawatts of announced projects does not represent 20 gigawatts of equal economic probability.
Disclose capital at risk before the next gate. Total capital expenditure answers the wrong question. Investors need to know how much capital becomes impaired if the next regulatory gate fails.
Developers
Secure material authorization earlier, because entitlement maturity is financial inventory. A permitted, power-secured site holds value when construction markets weaken; an attractive site without a credible authorization path may hold very little.
Maximize pre-lease and counterparty coverage, so lenders underwrite one risk rather than three.
Finance in tranches, so capital becomes non-cancelable only as project probability rises.
Negotiate state terms before financing closes. A developer who closes financing before state obligations stabilize hands government an option on its own balance sheet.
Name the ultimate parent on the initial application. The filing itself is inexpensive, although early parent disclosure can raise land-acquisition costs, and severing the opacity loop at its origin is worth the premium.
Lenders and institutional investors
Underwrite the authorization stack directly rather than substituting a hyperscaler tenant’s credit rating for project authorization analysis.
Measure capital exposed before the next unresolved gate.
Distinguish legal ring-fencing from economic recourse, and ask what voluntary sponsor retention survives the July 29 staff letter.
Stress-test delay rather than only cancellation, and ask what curtailment exposure the structure carries after June 1, 2027.
State lawmakers
Publish predictable authorization floors, and resolve grandfathering and transition rules before capital commits.
Separate cost causation from discretionary extraction.
Require identification of the ultimate parent in siting applications. The requirement costs the state nothing, breaks an equilibrium no sponsor can break alone, and addresses the leading cited cause of project cancellation.
Recognize that indefinite pauses cost sponsors more than demanding terms, and that uncertainty raises the financing price without changing the nominal legal burden.
Federal lawmakers and regulators
Recognize that fragmented state authorization now transmits into national infrastructure financing.
Federal acceleration that leaves downstream state and local variance untouched moves the bottleneck without reducing its capital cost.
Design federal performance standards and transmission policy around the financeability of the whole authorization stack rather than federal permit speed alone.
Across all five audiences the instruction is the same one stated differently. Find out what permission actually costs, in months and in basis points, before the capital becomes impossible to move.
XVI. How MindCast Generated Foresight Predictions
MindCast produced the register below by running the analysis as a MindCast AI Proprietary Cognitive Digital Twin Foresight Simulation (MP CDT FS) rather than by expert judgment. A reader deciding how much weight to place on a number deserves the method first.
System provenance. The register includes outputs generated through an independent Claude implementation of the MindCast MP CDT FS runtime.
The simulation builds behavioral models of the actors, not summaries of them. Nine Cognitive Digital Twins were instantiated for this run: a state government twin, a grid operator twin, a local government twin, a community coalition twin, three developer twins representing balance-sheet-first, contract-first, and independent capital architectures, a bank lender twin, and a composite creditor twin covering private credit, rating agencies, and securitization investors. A system twin carries the governance equilibrium state. Each twin encodes objectives, constraints, beliefs, incentives, available options, installed decision grammar, adaptation velocity, pressure thresholds, response policy, observable signals, failure modes, and its own falsifier.
Four explanations competed, and the run chose among them. Structural constraint, strategic use of delay, incentive response, and institutional coordination each offer a complete account of why sponsors concede to states. The simulation forced them to compete rather than blending them into a synthetic score, and where two remained viable it branched instead of averaging. Section VII reports the result.
Cognitive Digital Twins play against each other, never against themselves. The unit of foresight is adversarial cross-simulation. A developer twin bargains against a state twin and separately against a lender twin. A large-load twin contests a grid operator twin. A developer twin faces a community coalition twin. Every recorded interaction pairs distinct actors in contest, and a run without executed cross-twin interaction is analysis rather than simulation.
Causal claims pass an integrity gate before they can carry a prediction. Each claim scores on whether visible action honestly expresses the underlying decision system, whether stated commitments translate into observable behavior, and whether the signal holds across time and across actors — penalized for confounding. A claim scoring below the release threshold cannot support a released forecast regardless of how compelling the argument reads.
Termination requires two independent conditions. Behavior must converge — no actor improves by unilaterally changing strategy — and further search must stop adding enough information to justify its cost. Convergence alone does not close a run.
Predictions lock before the simulation ends, not after. Inputs lock first, routing next, predictions last. Every entry below settles against a named source.
What the method cannot do. The simulation tests whether a specified architecture executed faithfully and whether claims survive the integrity gate. Predictive accuracy settles only against the public record, separately and later. A well-executed run is not a correct one, and MindCast grades the two on separate ledgers.
XVII. Foresight Prediction Register
Every entry carries a settlement source, an explicit falsifier, a dated window, and whether the claim governing it cleared the causal-integrity gate. Event probabilities and interpretive confidence never pool.
Version 1.0: thirteen event predictions grouped by the signal they generate, two hypotheses under test, three structural reads.
Reading the causal-integrity line. Cleared entries carry probabilities. Entries below the threshold carry none, and appear as hypotheses with tests attached.
The definitions below govern every settlement. Top-ten project means a 2026-announced US project ranking in the top ten by announced IT capacity in megawatts. Additional state means a state without an approved mandatory large-load tariff as of August 11, 2026. Historical retention practice means the median disclosed sponsor retention across data center securitizations closing between January 1, 2024 and July 28, 2026. Delay tolerance classifies objectively: low where any of trailing-twelve-month free cash flow is negative, construction debt is drawn against the parcel, or a contractual delivery date falls within twenty-four months; high where free cash flow is positive, project capital remains undrawn, and two or more alternative announced sites sit in different power markets; medium otherwise.
Credit Documentation — What Becomes Standard Covenant Architecture
P1 — Permit-to-draw conditions spread. Three or more data center financings originated after August 11, 2026 disclose construction-draw conditions tied to permits, leases, or authorization milestones. Window: by June 30, 2027. Falsifier:fewer than three disclosed. Settlement: offering documents, SEC filings, reporting in Reuters, Bloomberg, or IFR. Note:the CyrusOne package predates this publication and does not count. Causal integrity: cleared, strongest tier. Event probability: 65–75%.
P2 — Rating methodology names authorization. At least one of S&P, Moody’s, or Fitch publishes criteria or sector commentary naming permitting status or community opposition as an explicit rating factor for data center project finance.Window: by December 31, 2027. Falsifier: no such publication. Settlement: the agency’s published criteria and commentary archive. Causal integrity: cleared, strongest tier. Event probability: 60–70%.
P3 — Curtailment named as risk. Curtailment exposure appears as a named risk factor in at least one data center financing document or rating report. Window: by December 31, 2027. Falsifier: no such appearance. Settlement: offering documents, SEC filings, rating agency reports. Causal integrity: cleared. Event probability: 60–70%.
P4 — Curtailment structured, not just disclosed. A data center financing discloses a curtailment reserve, curtailment covenant, or curtailment-adjusted coverage ratio. Window: by December 31, 2027. Falsifier: risk-factor language only, with no structural provision. Settlement: offering documents, rating agency reports. Causal integrity: cleared. Event probability: 40–50%.
Capital Markets — Where the Money Moves
P5 — Securitization volume rises. Data center asset-backed and mortgage-backed issuance in calendar 2026 exceeds the 2025 total. Window: reported by February 28, 2027. Falsifier: 2026 issuance at or below 2025. Settlement: Asset Securitization Report, Bloomberg issuance data. Causal integrity: cleared. Event probability: 75–85%.
P6 — Concessions become investor evidence. At least two sponsors cite a ratepayer-protection agreement, generation commitment, transmission contribution, community benefits agreement, or authorization certainty as evidence of reduced execution risk in an earnings call, investor presentation, financing document, or company release. Window: by December 31, 2027. Falsifier: fewer than two such citations. Settlement: earnings transcripts, investor presentations, offering documents, company releases. Causal integrity: cleared. Event probability: 65–75%.
Authorization and State Response — What the Rule-Setters Do Next
P7 — FERC approves the PJM backstop. FERC approves PJM’s Reliability Backstop Procurement in substantially the filed form. Window: by December 31, 2026. Falsifier: rejection, or approval requiring restructuring that removes the bilateral offset mechanism. Settlement: FERC eLibrary, docket ER26-3380. Causal integrity: cleared. Event probability: 70–80%.
P8 — Bilateral capacity becomes credit evidence. At least two large-load customers publicly disclose a bilateral capacity contract or self-supply arrangement citing PJM cost allocation or curtailment avoidance. Window: by June 1, 2027. Falsifier: fewer than two disclosures. Settlement: PJM filings and match disclosures, company disclosures, earnings materials. Causal integrity: cleared. Event probability: 60–70%.
P9 — Ownership disclosure becomes compulsory. At least one state enacts a statutory requirement that data center siting applications identify the ultimate parent or beneficial owner. Window: by adjournment of 2027 regular legislative sessions. Falsifier: no enactment. Settlement: enacted session law. Causal integrity: cleared. Event probability: 55–65%.
P10 — Large-load tariffs spread with long terms. At least one additional state enacts or its commission approves a mandatory large-load tariff carrying a minimum term of ten years or longer. Window: by December 31, 2027. Falsifier: no new enactment or approval meeting the term threshold. Settlement: enacted session law, commission orders. Causal integrity: cleared. Event probability: 65–75%.
P11 — A state prices financing readiness. At least one state, public utility commission, or major local authorization process expressly uses applicant financing readiness, financial assurance, credit quality, or demonstrated capital commitment as a project-selection variable beyond conventional security requirements. Window: by December 31, 2027. Falsifier: no such use. Settlement: statute, tariff, commission order, request for proposals, executive directive, executed development agreement. Causal integrity: cleared. Event probability: 55–65%.
Project Outcomes and Instrument Validation
P12 — A major project dies on authorization. At least one top-ten US data center project announced in 2026 is publicly cancelled, terminated, or indefinitely paused, with local opposition or permitting named among the reasons. Window: by December 31, 2027. Falsifier: no such event, or cancellation attributed solely to demand or supply chain. Settlement:company announcements, Data Center Watch tracking, county records. Causal integrity: cleared. Event probability: 75–85%.
P13 — The instruments sort risk. Among large US projects announced in 2026, those scoring FAC below 0.50 while scoring CIR above 0.60 experience repricing, restructuring, material delay, or cancellation at a higher rate than projects in the other three quadrants. Window: by December 31, 2027. Falsifier: comparable or lower adverse-event rates in the hold-up-exposed quadrant. Settlement: MindCast project dataset scored against company announcements, offering documents, rating actions, and Data Center Watch tracking. Causal integrity: cleared. Event probability: 60–70%.
P13 is the instrument-validation entry. A failure retires Financeable Authorization Coverage and Capital Irreversibility rather than qualifying them.
Hypotheses Under Test
P14 — Delay tolerance predicts concession. Among a matched sample of major projects receiving material new authorization terms, sponsors classified low on delay tolerance accept higher normalized authorization prices than sponsors classified high.
Matching rule. Projects match on announced capacity within one standard deviation, on power market, and on announcement year. Delay tolerance classifies by the definition above. Normalized authorization price sums committed system investment, guaranteed minimum payments, exit protection, and community benefit obligations, divided by contracted megawatts. Observation closes December 31, 2027.
Falsifier: comparable or lower normalized concession by low-tolerance sponsors under the rule above. Settlement:MindCast project dataset against executed development agreements, tariff filings, community benefit agreements, and disclosed financing posture. Causal integrity: below the release threshold — held as hypothesis. The Financing Inversion stands or falls here.
P15 — Retention divergence. Data center securitization issuance rises after the July 29 SEC staff letter while median disclosed sponsor retention on structures closing after that date falls below the historical practice defined above. Window:by December 31, 2027. Falsifier: post-letter median retention at or above the historical median. Settlement: offering documents, issuance data, rating agency reports. Causal integrity: below the release threshold — held as hypothesis.
P16 — GPU residual value enters credit documentation. At least one financing originated under the Nvidia-arranged platforms discloses a residual-value assumption, GPU depreciation schedule, or collateral revaluation trigger.
Window: by December 31, 2027. Falsifier: no such disclosure. Settlement: offering documents, SEC filings, rating agency reports. Causal integrity: cleared.
Event probability: 55–65%.
Structural Reads — Interpretive Confidence, Never Pooled With the Above
S1 — Certainty beats permissiveness. Capital concentrates in jurisdictions publishing bounded, calculable terms over jurisdictions offering low nominal burden with unresolved rules. Observable: pipeline redirection following a jurisdiction’s terms becoming explicit. Interpretive confidence: 70–80%.
S2 — Geometry governs through 2027. Physical and capital constraints — lead times, queue position, drawn capital — govern authorization outcomes more than sponsor conduct over the next eighteen months. Observable: conduct improvements failing to compress timelines in constrained corridors. Interpretive confidence: 60–70%.
S3 — Extraction frontier crossing. At least one jurisdiction extracts past the point where the extraction raises its own future cost of capital. Observable: developer pipeline redirection following a named extraction event. Interpretive confidence: 55–65%.
Investor Transmission Cards
Predictions state what happens. A transmission card states how it reaches a position. Each card traces a trigger to an observable an investor can check on a dated schedule.
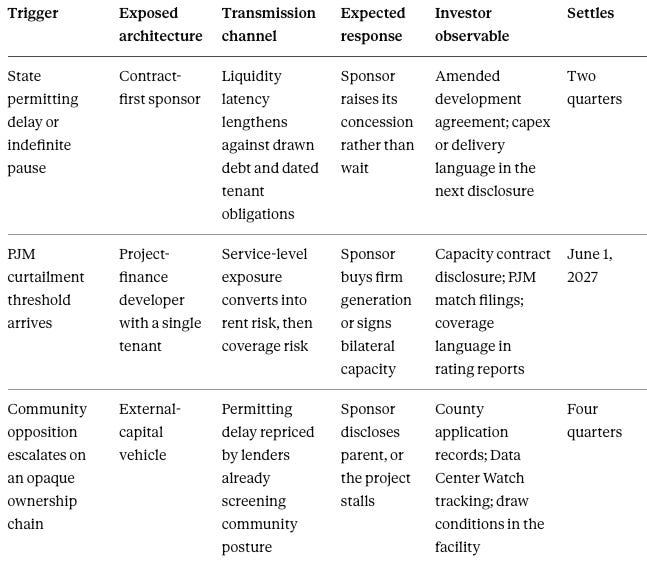
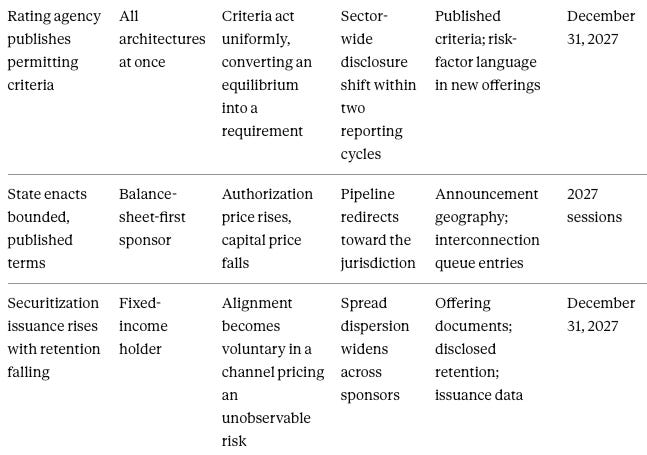
The same scoring produces four exposure states, which are positions rather than recommendations.
Favorable — high authorization maturity, low irreversibility, strong geographic optionality.
Watch — high authorization maturity, high irreversibility. Risk retired, flexibility spent.
Speculative — low authorization maturity, low irreversibility. Contained, and not yet earning.
Hold-up exposed — low authorization maturity, high irreversibility. The quadrant where an authorization shock most likely becomes a credit event, and where a state holds the most leverage.
Falsification Contract For the Publication
The confidence constraint fails if authorization uncertainty shows no measurable relationship to financing cost or structure across the 2026–2027 cohort — specifically, if projects carrying documented organized opposition price at spreads statistically indistinguishable from unopposed comparables matched on size, sponsor, and region.
Revisions preserve the original entry and carry its identifier.
XVIII. Corrections and Limits
MindCast publishes corrections at the same level as findings.
The run downgraded two draft claims. MindCast executed the simulation before publication rather than after, and two claims fell below the release threshold. The run also found structural constraint binding over sponsor conduct, which reduces the near-term effect of the developer actions in Section XV — those actions remain correct and nearly free, and will move outcomes less over eighteen months than an intent-based reading predicts.
Correction. An earlier working formulation of this analysis treated the organizational separation between government affairs and treasury as an unrecognized industry failure. The claim overstated the case. Power Brokers and Digital Real Estate documented in November 2025 that high-coherence developers had already built community affairs divisions staffed by former utility regulators and municipal planners, with community liaisons reporting directly to chief financial officers because trust velocity affects capital access. The organizational remedy was identified before this publication. Adoption breadth remains unmeasured.
Three limits bound the analysis.
The capital price is inferred, not observed. Project-level spreads on private credit and 144A issuance are not public at the granularity the argument would ideally use, so the analysis reasons from issuance structure, rating actions, and disclosed terms. The same limitation constrains the November 2025 magnitude forecasts, which is why Section II grades the mechanism and withholds the numbers.
The extraction inversion rests on direction, not magnitude. One transaction supports a directional argument. Confidence bands throughout mark the difference between a mechanism identified and a mechanism measured.
Timing is unresolved. Lenders have begun pricing authorization risk. Whether the pricing hardens into standing covenant language, softens as competition for AI exposure intensifies, or fragments by region stays open, and the register above exists to settle it.
Conclusion — Authorization Becomes a Component of the Cost of Capital
The AI data center buildout began as a technology story. Compute demand collided with the grid and made it an energy story. Power scarcity, ratepayer exposure, water use, and local opposition forced governments to ration permission and made it a regulatory story.
The buildout is now a credit story, and MindCast forecast the transition nine months before the reporting confirmed it.
Debt, leases, private capital, SPVs, project structures, securitizations, and customer commitments increasingly finance the physical layer. Once they do, liquidity latency enters the capital structure and authorization delay begins accruing against drawn money.
A legislative session alters a financing model. A utility tariff changes fixed obligations. A community fight moves a construction draw. A curtailment rule taking effect in June 2027 reaches leases signed today.
Permission therefore carries a second price. The Authorization stream measured what states charge. The Capital stream measured what institutional coherence earns. Joining them answers a question neither could reach alone:
The authorization price becomes a credit spread when regulatory uncertainty changes the timing, probability, or recoverability of the cash flows supporting capital.
The reciprocal proposition may prove more consequential:
Capital structure determines how much authorization price a firm can rationally resist.
Financial capability gets a project to the table. Financial irreversibility keeps it there.
Firms that grasp the distinction can build capital structures preserving bargaining power and investor confidence at once. States that grasp it can write demanding rules without making projects unfinanceable. Creditors that grasp it can tell a billion-dollar facility apart from a billion-dollar claim on permission not yet secured.
The next unit of account in AI infrastructure is not another measure of capital expenditure. The unit is financeable certainty.
Analysts must therefore ask not only what a state will charge, but which counterparty has already committed capital in a way that removes its ability to refuse.
Appendix A — Published Theoretical Foundations
Four published MindCast frameworks supply the theory the simulation runs on. Each is public; the runtime architecture that applies them is not.
Chicago School Accelerated (December 2025) — Supplies the foundation for treating authorization as bargaining rather than administrative process. Coase separates coordination costs from transaction costs. Becker explains ownership opacity as locally rational conduct while opacity carries no price, and predicts reversal once credit committees attach one. Posner supplies the lag between financing cycles and legal correction.
The Dual Nash-Stigler Equilibrium Architecture (January 2026) — Nash identifies where strategic actors stop improving through unilateral deviation, and supplies the equilibrium reading of the opacity loop in Section IX that separates a stable best response from a correctable error. Stigler governs diligence sufficiency — how far a lender searches community and permitting evidence before the marginal information stops justifying its cost — which is a separate question from the underwriting criteria themselves.
MindCast AI Field-Geometry Reasoning (January 2026) — Treats strategy as movement through a constraint field where timing, capital, and switching costs determine which paths survive. Before commitment a developer holds multiple routes: relocate, resize, delay, restructure, substitute power, or walk. As capital becomes irreversible those routes steepen and some close. Debt does not eliminate agency; debt prices agency.
The Dynamic Predictive Game Theory Collection (July 2026) — Models systems where events rewrite the payoff structure rather than change one variable inside a fixed game. A tariff decision, a debt draw, a tenant commitment, a downgrade, and a moratorium each change the game, which is why delay tolerance must update continuously rather than score once.
Appendix B — The Authorization Corpus
Each entry below supplies a proposition this publication extends.
The MindCast AI Data Center Record — Twelve months of dated claims graded against the public record, with three published corrections.
The Authorization Market — Permission as a scarce economic good, with predictable terms outperforming nominal permissiveness because capital can underwrite them. Extended here: what happens once the price enters a capital structure.
The 50-State Authorization Price Baseline — Strictness, certainty, and authorization friction separated across every state. Extended here: certainty and friction become inputs to Authorization Credit Exposure (ACX).
The 50-State Regulatory Atlas — The standing jurisdictional record. Extended here: the dataset bankers currently approximate by intuition.
The Model AI Infrastructure Authorization Code — Scores any data center law on obligation, consequence, and reach. Extended here: supplies the materiality hierarchy inside Financeable Authorization Coverage.
Three Competing Governance Equilibria — Stable arrangements the contest converges toward. Extended here:Financing Posture changes which equilibrium clears.
The Two-Ledger Data Center Bargain — What a project contributes measured against what it consumes. Extended here: a concession that reduces delay variance operates as credit enhancement.
The Federal-State AI Infrastructure Collision — Nine dated checkpoints; cost allocation settled five months early at FERC. Extended here: multi-layer timing becomes a financing-duration problem.
The Power Stack — Bottleneck power migrating toward actors controlling scarce infrastructure. Extended here: capital structure governs how shocks propagate.
The Bottleneck Hierarchy — Secured firm power decides the buildout. Extended here: supply-or-curtail converts that operating advantage into a financing one.
Appendix C — The Investor and Capital Corpus
Capital Is the New Computing (November 2025) — Establishes capital permanence, names liquidity latency, and identifies the speed, scale, and duration mismatches between project finance and AI timelines. Extended here: liquidity latency is jurisdiction-dependent, and the jurisdictional component is measurable.
Power Brokers and Digital Real Estate (November 2025) — Establishes that lenders underwrite energization timing as rigorously as tenant creditworthiness. Extended here: Section II grades the forecast against the August 2026 record.
Building CRE Coherence for AI Infrastructure (November 2025) — Models twelve platforms across six constraint scenarios and documents capital sequencing discipline. Extended here: sequencing preserves the reservation price, not only the return.
The AI Infrastructure Energy Opportunity Landscape (March 2026) — Introduces Capital Vision, separating constraint-removal capital from choke-point capital. Extended here: the same test applies to authorization strategy.
Executive Summary of the MindCast AI Investment Series (September 2025) — Five studies establishing trust and foresight integrity as quantifiable assets. Extended here: firm-level coherence complements the project-level ratios in Section XI.